
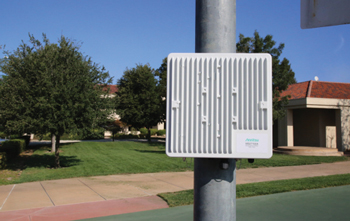
Figure 1 Remote spectrum monitors.
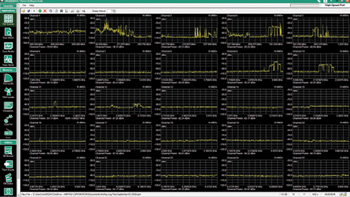
Figure 2 Multiple-source signals in Vision software.
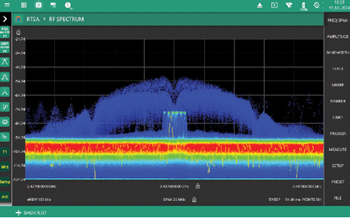
Figure 3 Pulsed signal hidden in an ISM-band Wi-Fi carrier.
The RF spectrum is becoming increasingly crowded as more technologies use radio signals for sensing, control and communications. Commercial communications systems, including public cellular, first responder radios, digital mobile radio and Bluetooth/wireless LAN, crowd the spectrum below 6 GHz. These technologies compete for spectrum allocation with satellite communication in the 1 to 4 GHz bands and air traffic control and commercial weather radar operating just below 3 GHz.
Deploying military communications in the field requires knowledge of background RF activity to ensure smooth and reliable communications. The very high frequency and ultra-high frequency bands are fundamental frequencies for military communications, but these individual radios are commonly networked using mobile ground-based satellite terminals. When deploying resources into new or threatening environments, the local RF environment is commonly analyzed. Networked mobile spectrum analyzers provide the building blocks for this activity. The survey typically includes monitoring RF background activity and gaining insight into the origin of unknown signals.
LOCAL AREA SPECTRUM MONITORING
Monitoring the background RF environment requires spectrum monitors located at strategic positions around the site of interest. The analyzers continuously sweep frequency bands of interest and spectrum traces are logged and recorded over an extended time. Anritsu MS27101A Remote Spectrum Monitors are ideal for this application, with a frequency range of up to 6 GHz. Formats include standard half-rack chassis, IP67 outdoor chassis or 24 RF port rack-mount chassis for multiple antennas. Figure 1 shows a representative equipment location for a secure compound.
Anritsu’s Vision Software controls the remote spectrum monitors, schedules spectrum captures and archives the spectrum traces into a database. Vision is PC-based, using an Ethernet connection to communicate with spectrum monitors. Vision software on one PC can control multiple monitors. Monitoring a large compound requires many networked monitors that archive a spectrum trace at a scheduled time interval. The number of traces in the database can quickly become too large to analyze manually. Tools within the Vision software enable filtering by signal level or the sudden appearance of a new signal. Figure 2 shows a representative multiple-source spectrum display.
When signals of interest, such as potential interfering or nefarious signals, are identified in background testing, their source is located and purpose identified. Nefarious signals are often transmitted at the same frequency as desired transmissions but at lower power levels using spread spectrum modulation to hide their presence. These signals are difficult to find and the best detection tool is a real-time spectrum analyzer (RTSA). An RTSA displays RF power spectral density and highlights the presence of an RF transmitter, even if there is a larger signal at the same frequency. These hidden signals are not visible on a traditional swept frequency spectrum analyzer that detects the peak or average power at each frequency point. Anritsu’s MS27201A remote spectrum monitors and Field Master spectrum analyzers all offer an RTSA option with frequency ranges up to 54 GHz and analysis bandwidths up to 110 MHz. Figure 3 shows an example of this hidden signal.
SIGNAL IDENTIFICATION
Once a signal of interest has been spotted, further insight must be gained into its characteristics. The best technique for analyzing signals of unknown origin is an I/Q signal capture coupled with post-processing using MATLAB or Anritsu’s MX280005A I/Q Signal Master (see Figure 4). Selecting a capture bandwidth matching the signal of interest’s bandwidth can keep the I/Q data file size manageable. Sixteen bits of resolution is typically sufficient for signal processing.
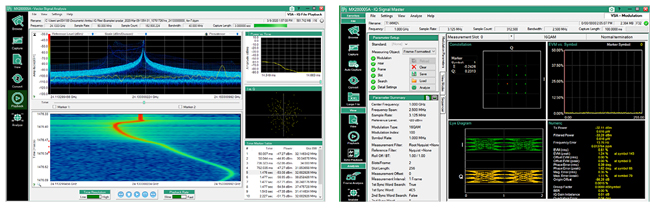
Figure 4 I/Q Signal Master showing the frequency signature of a transmitter power-up and 16QAM signal data.
I/Q files can be captured as single, time-limited events that are saved to the internal instrument memory or as a continuous data stream to an external USB 3.0 SSD drive or a PC with a PCIe interface (required to capture and manage the data flow). Replaying the I/Q data using MATLAB or Signal Master provides insight into the signal characteristics. For pulsed or TDD signals, the RF turn-on and frequency lock time are displayed. These parameters give a unique signature for each transmitter technology. By comparing these characteristics with a library of known threats and signals, the signal origin often becomes clear.
DATA SECURITY
In all the use cases described, sensitive information is distributed over a network, typically Ethernet. Hostile agencies can easily detect an unsecured Ethernet network, collecting control commands between the PC and the spectrum monitor and copying traces and files. This provides those agencies with knowledge of the RF activity on a site, hostile and legitimate.
Anritsu remote spectrum monitors provide a secure communications option to prevent access to sensitive frequency, spectrum and I/Q data. When connecting the remote spectrum monitor to a network, Option 17 creates a secure tunnel and closes unused communication ports to all traffic. As an additional layer of security, the ports can be password-protected, preventing simple connection by searching for active IP addresses.
Remote spectrum monitors are the ideal instrument for monitoring and safeguarding RF activity at sensitive locations. In addition to monitoring basic spectrum and creating RF background activity databases, an RTSA can detect hidden signals and I/Q data capture enables detailed insight into signals of interest. Data integrity and security are expectations of monitoring networks and the Anritsu Remote Spectrum Monitors offer secure encrypted communications to meet these needs.
Anritsu
Morgan Hill, Calif.
anritsu.com/en-us/