
Editor's Note: The author has revised this article. The new revision can be found here.
Many papers discuss the system trade-offs and relative merits of digital, RF and hybrid beamforming.1 Building on prior work, this article uses RF-to-ADC cascade modeling to show dynamic range (linearity and noise) and sample rate trade-offs versus DC power consumption in a multichannel system with varying channel summation in both the RF and digital realms. The optimal selection of sample rate, ADC effective number of bits (ENOB) and RF versus digital channel combining is weighed against DC power consumption. The popular Schreier and Walden ADC figures of merit (FOMs) are proposed as extensible to a multichannel system to express a single system FOM portraying optimal dynamic range normalized for DC power considerations. The article has two parts: Part 1, published in the January 2024 edition of Microwave Journal, explains the method of modeling the system and Part 2 analyzes the results and draws conclusions from system FOMs.
SYSTEM MODELING RESULTS
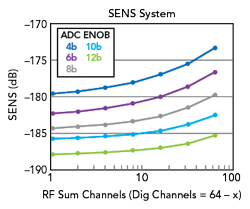
Figure 1 System sensitivity versus the number of RF channels summed.
The system model results presented in the following plots consist of the attributes and swept variables shown in Table 1.
Sweeping RF Channel Summation
The examples in this section use a subarray size of 64 channels. The horizontal axis in these plots shows the model swept from an all-digital summation on the left (64-channel digital sum, no RF sums) to an all-RF summation on the right (no digital sum, 64-channel RF sum). In between is a blend of digital and analog channel summations, referred to as hybrid beamforming with the RF channel summation increasing from left to right along the x-axis.
Figure 1 shows the system sensitivity versus the number of RF channels summed while ADC ENOB is varied. Figure 2 shows the system spurious-free dynamic range (SFDR) versus the number of RF channels summed while ADC ENOB is varied and Figure 3 shows the system DC power per element versus the number of RF channels summed with the same variation in ADC ENOB. The problem is that viewing sensitivity, SFDR and DC power results individually does not indicate if it is good or bad because performance is portrayed separately from power. For example, maximum SFDR at the lowest possible DC power consumption is the goal, but what configuration of ADC ENOB and RF-to-digital combining is best? The next section is a more useful apples-to-apples comparison, as the results show performance with the dynamic range normalized for DC power consumption.
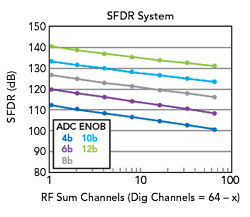
Figure 2 System SFDR versus the number of RF channels summed.
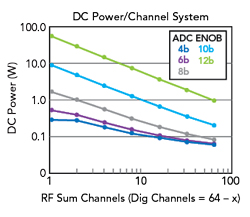
Figure 3 Overall DC system power per element versus the number of RF channels summed.
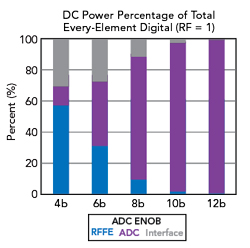
Figure 4 DC system power from RFFE, ADC and digital summation when every element is digital.
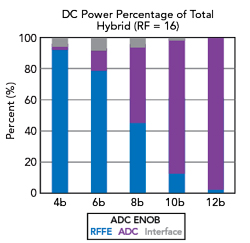
Figure 5 DC system power from RFFE, ADC and digital summation for a medium-sized RF subarray.
Sweeping ADC ENOB
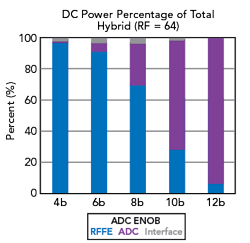
Figure 6 DC system power from RFFE, ADC and digital summation for a large RF subarray.
The plots in this section show the results of sweeping ADC ENOB for combinations of beamforming architectures. Trends in DC power and performance (SFDR and SENS) are analyzed as these parameters are swept. The figures in this section show the relative percentage of power consumed by the RF front-end (RFFE), ADC and the digital summation/interface. Figure 4 represents the digital beamforming case, where every element is digital. Figure 5 shows the same results for a hybrid system architecture that sums 16 RF channels and Figure 6 shows the results for a large RF subarray that uses hybrid beamforming with 64 RF channels summed.
Unsurprisingly, the results show that the contribution of the digital interface and summation functions become more important as the number of digital elements increases. Figure 4 shows a large proportion of the overall power consumption can be attributed to the digital interface at the lower bit resolution values, but this decreases rapidly as bit resolution increases. However, for systems with higher RF channel summations, the digital interface is less significant. Another trend is that the RFFE is dominant at low ADC bit resolutions, but the ADC is dominant at high ADC bit resolutions. These plots show the big impact ADC ENOB and the RF-to-digital channel summation ratio have on DC power consumption.
Normalizing SFDR and Sensitivity
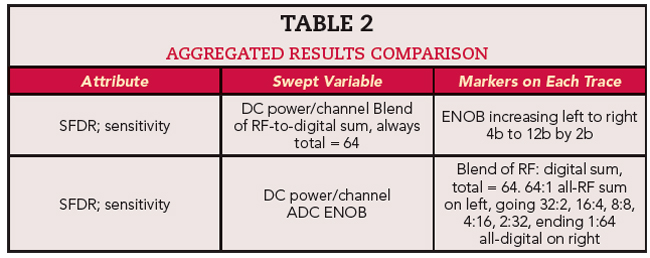
Next, the relative merits of SFDR and sensitivity are normalized for DC power/channel. This analysis is performed for different ADC ENOB and RF-to-digital channel summation schemes. Table 2 lists the swept variables and markers on each trace for the plots in this section.
The plots of sensitivity (Figure 1), SFDR (Figure 2) and DC power versus RF-to-digital channel summation (Figure 3) are rearranged to better visualize performance trends when normalized for DC power. Figure 7 and Figure 8 show SFDR and sensitivity versus DC power for a few fixed RF-to-digital summation examples. The discrete bit resolution values are shown on the RF = 1 curve and the variation in ENOB along the curves remains the same for the other RF channel summation curves.
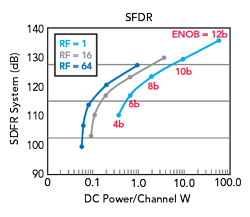
Figure 7 SFDR versus DC power/channel for different RF-to-digital summations.
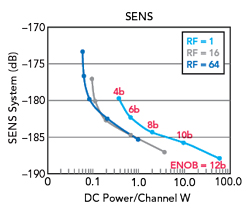
Figure 8 Sensitivity versus DC power/channel for different RF-to-digital summations.