
Selecting the Best ADC for Radar Phased Array Applications: Part 2
Editor's Note: The author has revised this article. The new revision can be found here.
Many papers discuss the system trade-offs and relative merits of digital, RF and hybrid beamforming.1 Building on prior work, this article uses RF-to-ADC cascade modeling to show dynamic range (linearity and noise) and sample rate trade-offs versus DC power consumption in a multichannel system with varying channel summation in both the RF and digital realms. The optimal selection of sample rate, ADC effective number of bits (ENOB) and RF versus digital channel combining is weighed against DC power consumption. The popular Schreier and Walden ADC figures of merit (FOMs) are proposed as extensible to a multichannel system to express a single system FOM portraying optimal dynamic range normalized for DC power considerations. The article has two parts: Part 1, published in the January 2024 edition of Microwave Journal, explains the method of modeling the system and Part 2 analyzes the results and draws conclusions from system FOMs.
SYSTEM MODELING RESULTS
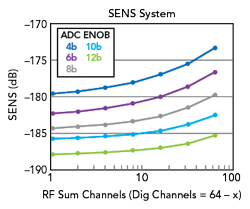
Figure 1 System sensitivity versus the number of RF channels summed.
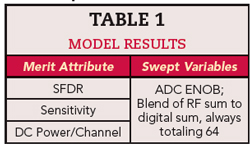
The system model results presented in the following plots consist of the attributes and swept variables shown in Table 1.
Sweeping RF Channel Summation
The examples in this section use a subarray size of 64 channels. The horizontal axis in these plots shows the model swept from an all-digital summation on the left (64-channel digital sum, no RF sums) to an all-RF summation on the right (no digital sum, 64-channel RF sum). In between is a blend of digital and analog channel summations, referred to as hybrid beamforming with the RF channel summation increasing from left to right along the x-axis.
Figure 1 shows the system sensitivity versus the number of RF channels summed while ADC ENOB is varied. Figure 2 shows the system spurious-free dynamic range (SFDR) versus the number of RF channels summed while ADC ENOB is varied and Figure 3 shows the system DC power per element versus the number of RF channels summed with the same variation in ADC ENOB. The problem is that viewing sensitivity, SFDR and DC power results individually does not indicate if it is good or bad because performance is portrayed separately from power. For example, maximum SFDR at the lowest possible DC power consumption is the goal, but what configuration of ADC ENOB and RF-to-digital combining is best? The next section is a more useful apples-to-apples comparison, as the results show performance with the dynamic range normalized for DC power consumption.
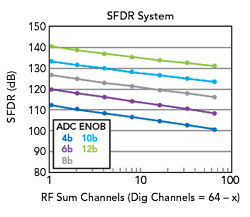
Figure 2 System SFDR versus the number of RF channels summed.
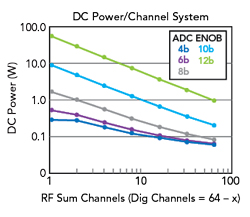
Figure 3 Overall DC system power per element versus the number of RF channels summed.
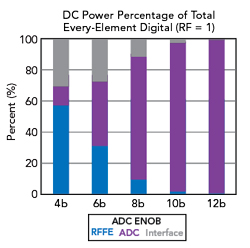
Figure 4 DC system power from RFFE, ADC and digital summation when every element is digital.
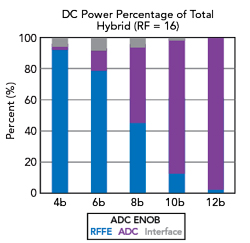
Figure 5 DC system power from RFFE, ADC and digital summation for a medium-sized RF subarray.
Sweeping ADC ENOB
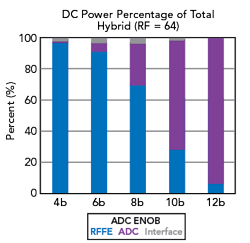
Figure 6 DC system power from RFFE, ADC and digital summation for a large RF subarray.
The plots in this section show the results of sweeping ADC ENOB for combinations of beamforming architectures. Trends in DC power and performance (SFDR and SENS) are analyzed as these parameters are swept. The figures in this section show the relative percentage of power consumed by the RF front-end (RFFE), ADC and the digital summation/interface. Figure 4 represents the digital beamforming case, where every element is digital. Figure 5 shows the same results for a hybrid system architecture that sums 16 RF channels and Figure 6 shows the results for a large RF subarray that uses hybrid beamforming with 64 RF channels summed.
Unsurprisingly, the results show that the contribution of the digital interface and summation functions become more important as the number of digital elements increases. Figure 4 shows a large proportion of the overall power consumption can be attributed to the digital interface at the lower bit resolution values, but this decreases rapidly as bit resolution increases. However, for systems with higher RF channel summations, the digital interface is less significant. Another trend is that the RFFE is dominant at low ADC bit resolutions, but the ADC is dominant at high ADC bit resolutions. These plots show the big impact ADC ENOB and the RF-to-digital channel summation ratio have on DC power consumption.
Normalizing SFDR and Sensitivity
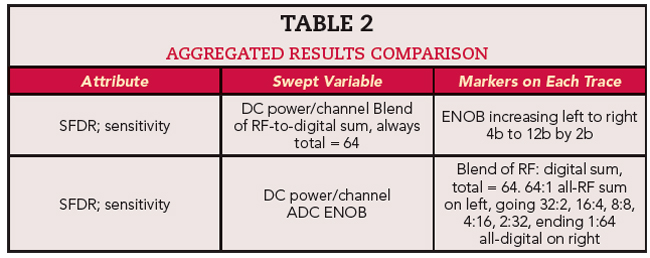
Next, the relative merits of SFDR and sensitivity are normalized for DC power/channel. This analysis is performed for different ADC ENOB and RF-to-digital channel summation schemes. Table 2 lists the swept variables and markers on each trace for the plots in this section.
The plots of sensitivity (Figure 1), SFDR (Figure 2) and DC power versus RF-to-digital channel summation (Figure 3) are rearranged to better visualize performance trends when normalized for DC power. Figure 7 and Figure 8 show SFDR and sensitivity versus DC power for a few fixed RF-to-digital summation examples. The discrete bit resolution values are shown on the RF = 1 curve and the variation in ENOB along the curves remains the same for the other RF channel summation curves.
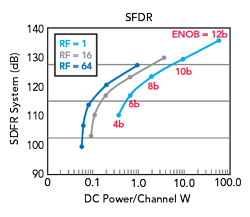
Figure 7 SFDR versus DC power/channel for different RF-to-digital summations.
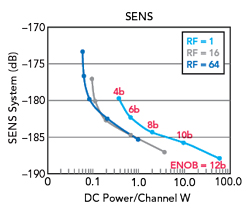
Figure 8 Sensitivity versus DC power/channel for different RF-to-digital summations.
Figure 9 and Figure 10 show the same underlying data arranged a bit differently. In this case, the traces represent ENOB values from 4 to 12. On each curve, the RF-to-digital summation varies along the trace, ranging from an all-RF sum as the first point on the left of the curve to an all-digital sum on the right of each curve. The advantage of presenting the data in this format is that performance versus DC power conclusions can now be drawn from the plots.
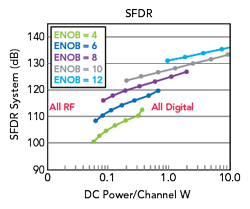
Figure 9 SFDR versus DC power/channel.
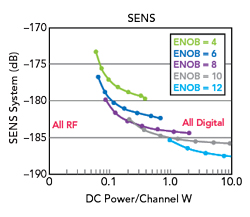
Figure 10 Sensitivity versus DC power/channel.
Table 3 summarizes the conclusions from the plots. In general, for the same SFDR and sensitivity, hybrid beamforming systems employing a blend of RF and digital beamforming require an ADC with a higher ENOB versus an all-digital solution. However, these hybrid systems are more power efficient. The plots show a performance sweet spot when SFDR, sensitivity and DC power consumption are evaluated together. Diminishing returns exist as ENOB improves beyond the knee of the curves and values deteriorate fast as ENOB degrades from the knee. Is an all-digital solution better in any of these situations? From a dynamic range efficiency perspective where DC power is handicapped, no. The benefits of an all-digital solution occur in software-defined beamforming flexibility and adaptability but these benefits come at the expense of increased power consumption.
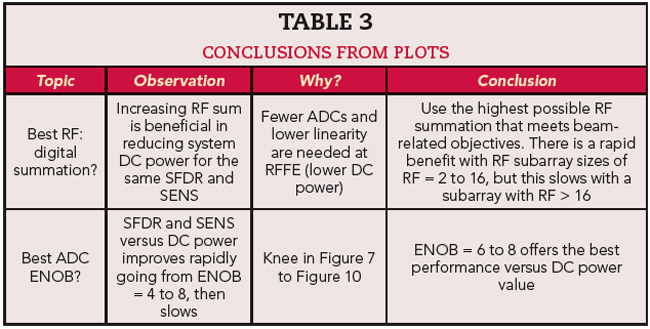
Table 4 provides a comparison of example scenarios with each having a different design priority. There is no single configuration that satisfies all the requirement scenarios. Different system objectives drive different performance priorities that force performance trade-offs with other attributes.
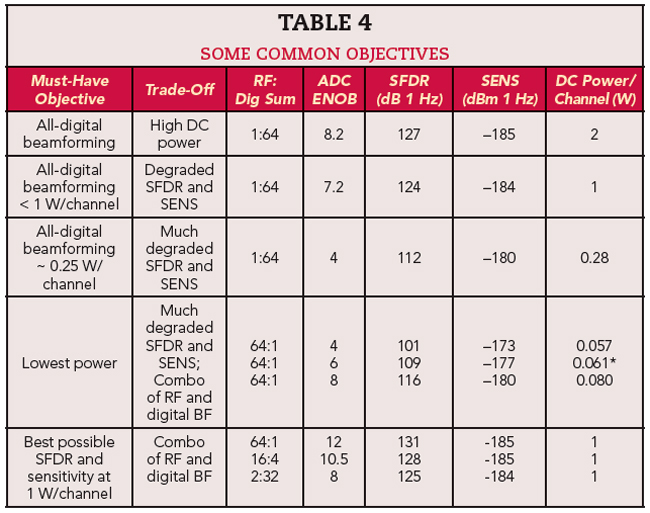
*Slightly higher, but better value
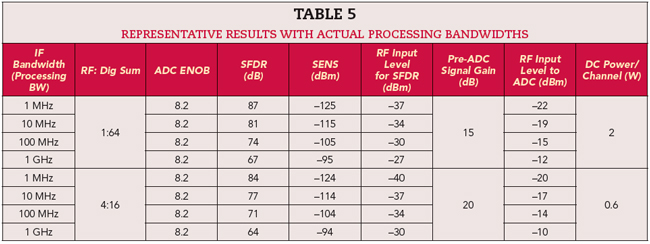
Table 5 shows a popular ADC ENOB = 8 example assuming practical IF bandwidths. A designer must pay attention to the signal level at the ADC, as the linearity of most ADCs degrades approaching full-scale input. The optimal RF operating level at the ADC increases as processing bandwidth increases. The ADC cannot be operated to full scale, in practice. In Table 5, it is important to note the limitation of the ADC input power and how it varies with IF bandwidth.
EVALUATING SYSTEM RESULTS
It is proposed that the Walden and Schreier ADC FOMs can be used to develop system FOMs to compare performance versus power trade-offs for RF-to-ADC cascades. The goal is to sweep parameters and spot the best value performance normalized for DC power at the system level. In this analysis, the FOMs are presented while:
- Varying RF-to-digital summation, ranging from all-digital to all-RF
- Varying ADC ENOB, linearity and DC power.
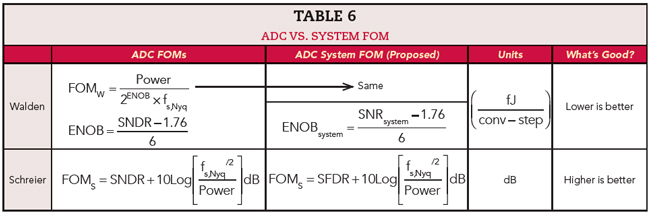
The migration from the ADC FOMs to the proposed ADC system FOMs is shown in Table 6. The proposed ADC system FOM based on the Walden ADC FOM is unchanged. The Schreier FOM can be modified by swapping SFDR for signal-to-noise and distortion ratio (SNDR) to make an FOM that reflects two-tone linearity performance.
Using these proposed ADC system FOMs and the relationships shown in Equation (1):
SNRsystem = NSDsystem,input–
Full Scalesystem,input+10Log
(Fs,Nyq/2)(1)
Where:
NSDsystem,input = -174 dBm/Hz + NF
SFDR (dB) = 2/3 (IIP3 (dBm) – Sensitivity (dBm))
Sensitivity (dBm) = -174 dBm/Hz + NF + 10Log(IFBW)
T = 290 K
Full Scalesystem,input = input-referenced full scale.
With these assumptions, Figure 11 shows the proposed ADC system FOM developed from the Walden FOM where a lower reading is better per the analysis in Table 6. Figure 12 shows the proposed ADC system FOM developed from the Schreier FOM where a higher reading is better. Both plots show the system FOM plotted versus the RF-to-digital sum ratio.
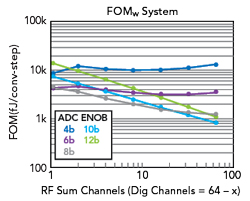
Figure 11 Proposed Walden-based system FOM (lower is better).
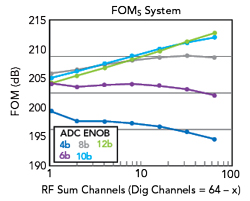
Figure 12 Proposed Schreier-based system FOM (higher is better).
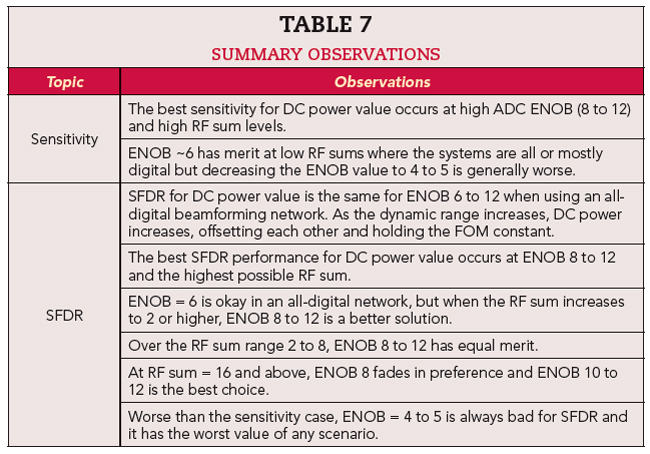
The phrase “best value” is meant in the sense of best performance for a given DC power consumption. The derived FOMs assist in drawing conclusions about this best value because they normalize performance against DC power consumption. Sensitivity observations are drawn from the Walden-based system FOM in Figure 11 and SFDR observations are drawn from the Schreier-based FOM in Figure 12. Table 7 contains some summary observations for both performance metrics.
CONCLUSION
Performance-critical applications like phased array radar deployments strive to find the optimal balance of sample rate, dynamic range and DC power. Overprioritizing any one of these parameters will result in a suboptimal and possibly bad solution. The era of 20 GSPS to 100+ GSPS ADC sampling is here, but higher sampling comes with a cost for DC power consumption and dynamic range (ENOB), the other two critical performance attributes in the FOM triad. High sample rates are not a design miracle, but a chosen prioritization of sample rate at the expense of higher DC power and lower ENOB. In many cases, the optimal ADC for a phased array system will prioritize dynamic range and DC power, with a sample rate just high enough for frequency planning efficiency and oversampling gain.
High dynamic range, high sample rate data converters with ENOB ~8 are popular choices for phased array radar applications because they offer the best compromise between dynamic range and DC power. However, designers should be careful how SNDR (ENOB) is defined and make sure to consider two-tone intermodulation performance with SNDR. Phased array radar ADCs also need high linearity with IP3 requirements typically greater than 22 dBm. When evaluating SNDR, know whether it includes interleave spurs and make sure spectral regions are not cherry-picked.
A system must have a significant mission-critical requirement to justify the use of high dynamic range, all-digital beamforming because this architecture comes at a steep DC power penalty. The arrays with the best balance of performance and DC power use a hybrid scheme, which is a combination of RF beamforming in subarrays that feed distributed DAC/ADC nodes that use digital beamforming. If beam attributes allow it, a small subarray of RF beamforming in front of each ADC helps improve performance and lowers DC power. RF beamforming is highly recommended for improving SFDR and sensitivity at lower DC power and providing blocker mitigation using beam null steering. Extra power is consumed to achieve the software-defined adaptability of fully digital beamforming.
Over the next five to 10 years, all-digital phased arrays will increase their technology readiness and viability at increasingly better performance. To enable this evolution, new state-of-the-art ADCs will put a greater emphasis on reducing DC power while maintaining sample rate and ENOB. ADC sample rate capability will continue to push higher, but these developments may benefit wideband applications, like electronic warfare, more than phased array applications. The phased array market will determine a sample rate sweet spot, perhaps in the 10 to 20 GSPS range, then the market winners will provide the best ENOB at the lowest power.
Reference
- P. Saha, “A Quantitative Analysis of the Power Advantage of Hybrid Beamforming for Multibeam Phased Array Receivers,” Analog Devices, Inc.