
Although orthogonal frequency-division multiplexing (OFDM) modulation schemes offer improved spectral efficiency in aerospace and defense applications, phase noise degrades their performance integrity. This article will provide calculations to measure phase noise variance or jitter within user-specified frequency offset limits. These calculations will allow users to determine the impact on the system error vector magnitude (EVM) across several constellation schemes. The phase noise calculations also provide insight into the impact of phase noise shape over frequency offset and how the shape affects overall EVM performance for a variety of bandwidth and subcarrier configurations. The measured performance of the Texas Instruments LMX2820 RF synthesizer provides empirical data on performance metrics when used as a sample clock for an RF-sampling transceiver.
Aerospace and defense applications such as high capacity low earth orbit satellite constellations and high security, small-resolution radar systems are growing. New modulation schemes efficiently use the available frequency spectrum while still providing a secure and reliable channel. An OFDM modulation scheme for aerospace and defense applications provides a wide dynamic range and immunity from interferers or jammers.
An OFDM signal contains multiple subcarriers, each providing a subset of the entire signal transmission. Losing one or more of the subcarriers from channel interference or multipath fading does not destroy the entire message. For radar applications, the subcarriers in the OFDM signal offer multiple phase references and frequency diversity to ascertain range and radial velocity more accurately than a simple linear frequency-modulated signal. For communication applications, the subcarriers allow more users in the same frequency space without interfering with each other.
The overall signal bandwidth and number of subcarriers determine the frequency spacing between subcarriers, according to Equation 1:

Each subcarrier is a pulsed signal in the time domain. The signal transforms into a SINC function in the frequency domain. The zero crossings of the subcarriers line up with the peaks of adjacent carriers, indicating that all signals are orthogonal and do not interfere with one another. In a real channel, phase noise impairments shift the zero crossings slightly and cause the subcarriers to interfere with one another slightly; this is called intercarrier interference (ICI).
Figure 1 illustrates OFDM subcarriers. The ideal case diagram shows the ideal distribution of the subcarriers while the with phase noise diagram shows how a phase noise-shifted subcarrier begins to affect its neighbor. The statistical variance of phase noise within a specified frequency window determines the amount of degradation.

Figure 1 OFDM subcarriers: ideal and with phase noise error.
PHASE NOISE CALCULATIONS
Integrating the frequency response, L(f), between two frequency limits calculates the phase noise variance. When using empirical measurements, calculating the area under the curve is not so easy because the response is typically measured on a log-log scale. It is possible to use online tools to determine the results, but those inputs are usually limited to a handful of frequency points and do not provide the granularity necessary for more accurate integration across arbitrary limits. The fundamental equations provide flexibility to modify the limits of integration for different OFDM configurations.
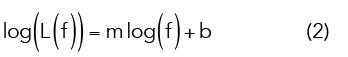
Break any arbitrary phase noise curve into small line segments where the response and frequency are on a log scale according to Equation 2:
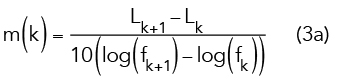
Equation 3a gives the slope, m, while Equation 3b gives the constant, b, where k represents the index of the data in a discrete array:

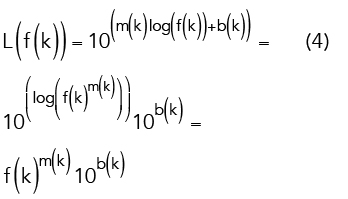
Equation 4 converts the phase noise response to the linear domain:
Integrating over two frequency points yields the area under one curve segment, expressed by Equation 5:

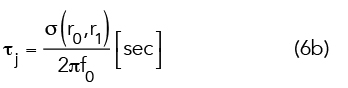
There is the possibility of an indeterminant function with a divide by zero if the slope is 10 dB over a frequency decade corresponding to an m value of -1. You can remedy this indeterminant function by taking the limit of the overall function, or simply perturbing the denominator with a small error value for the calculation. Summing each individual subsection per Equation 6a across the frequency limits of interest will calculate the phase noise variance. The factor of two compensates for the single-sideband nature of the phase noise plot. The variables r0 and r1 represent the index of the array that corresponds to the lower and upper frequency limits of integration. Convert the variance to jitter using Equation 6b at a specific measured frequency.

PHASE NOISE IMPACT ON EVM
The phase noise of each subcarrier interferes with all others within the signal. For any given subcarrier, its closest neighbors are most heavily affected; those farthest away are affected the least. The overall impact involves summing the error contributions from the variance of the phase noise of each subcarrier to all of its neighbors.