
This article describes a mobile network testing approach for 5G new radio (NR) using a passive scanner, which measures synchronization signal (SS)/physical broadcast channel (PBCH) blocks, or SSBs, broadcast from 5G NR base stations. It starts with relevant background information about 5G NR and mobile network testing, followed by a description of a typical measurement methodology for the frequency ranges one (FR1) and two (FR2). Next, it addresses two typical challenges: 1) finding carrier frequencies with SSBs and 2) network synchronization. A solution is proposed for each.
5G wireless radio access technology, known as NR, contains more flexibility to address different usage scenarios.1,2,3 The 5G NR specification allows optimization to reduce the latency and to significantly increase the data rate. These optimizations require many new technology components, including new frequency bands, beamforming support for synchronization and broadcast and multi-connectivity to enable the combination of 5G network elements with LTE. 5G NR supports operation in two frequency ranges: FR1 below 7,125 MHz4 and mmWave bands (FR2) between 24.25 and 52.6 GHz.5
Throughout the entire chain of laboratory testing, field trials, network rollout, optimization and benchmarking, measurement tools for mobile network testing (MNT) are required to characterize the conditions of the wireless channel and network coverage in the field.6,7 For example, measurements of received power enable verification of 5G NR cell beamforming and its impact on the coverage area. Measurements of the channel impulse response result in deeper knowledge about the propagation of wireless signals in different environments, i.e., reflection, absorption and scattering in urban versus rural areas. Measurements of arrival times enable verification of network synchronization aspects.8
5G and associated technologies such as beamforming and frequencies above 3 GHz have raised potential health concerns due to the human exposure to the electromagnetic field of base stations. Consequently, 5G base station deployment requires that the electrical field strength (V/m) is below the specific threshold for each country. Frequency selective measurement methods of exposure to 5G base stations have been described,9,10 emphasizing the need for code selective measurement methods, especially in networks with several base stations and with data traffic.
A mobile network operator must evaluate the quality of the network to investigate network problems, unwanted interference or assessment of new base stations. While it is possible to evaluate the performance of the network using a mobile phone, the disadvantage is measurement variation, as results vary depending on the chip set or installed software. Therefore, a reference measurement device such as a receiver or scanner is required, which provides a common ground for comparison.
With the use of non-standalone (NSA) and dynamic spectrum sharing, the 5G NR FR1 and corresponding LTE channel must be measured at the same time to ensure that both network links work as expected. Detection and measurement of these base station cells is challenging because the measurement must achieve a high sensitivity while avoiding false alarms that result in detecting non-existing cells (i.e., ghost codes).
Measurement of the carrier frequencies of a mobile network enables independent characterization of the network and, together with a wideband passive receiver, enables benchmarking of different networks—even networks that are completely unknown—removing the influence of the mobile phone. As this measurement approach is completely passive, all public and private networks, such as campus networks, can be detected and measured.
BACKGROUND
5G NR Synchronization Signal/PBCH Blocks (SSBs)
5G NR technology uses orthogonal frequency division multiplexing (OFDM)2 for downlink transmission. A band dependent table4,5 defines whether time division duplexing (TDD) or frequency division duplexing is used to divide the downlink (DL) and uplink (UL). A 5G NR cell broadcasts SSBs to enable cell search and initial access. One SSB is mapped to four OFDM symbols and 240 subcarriers (SC).
The SSB consists of one PBCH block, a primary and a secondary synchronization signal (PSS and SSS). There are different SC spacings (SCS) defined: from 15 kHz for Case A in FR1 to 240 kHz for Case E in FR2.11 Therefore, the bandwidth of one SSB is between 3.6 and 57.6 MHz. Correspondingly, the SSB duration is between 285 and 18 µs, enabling flexibility to use 5G NR in different frequency ranges and use cases.1
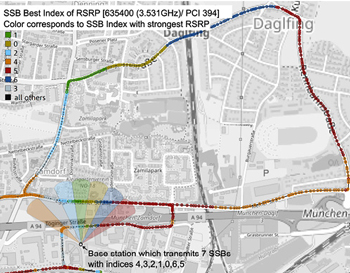
Figure 1 Transmission direction of seven SSBs of one cell estimated by comparing the measured received power for all SSBs during a drive test. The color of the route corresponds to the SSB with the strongest receive power.7

Figure 2 Setup for sub-6 GHz measurements of 5G NR FR1 and LTE signals.
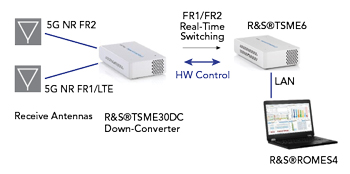
Figure 3 Setup with mmWave antenna and down-converter for simultaneous 5G NR FR2 and sub-6 GHz measurements.
One cell transmits up to 64 SSBs within a 5 ms window (i.e., up to four or eight SSBs for SCS of 15/30 kHz). Each of these SSBs has a specific index, which is encoded beside the cell-specific physical cell identity (PCI) into the SSB-signal. The start time of a SSB within the 5 ms window depends on the index, as defined by the 3GPP technical specification.11 The cells broadcast these 5 ms windows periodically, with the default period 20 ms.
Typically, a cell uses beamforming to transmit the SSBs in different directions (i.e., beam sweeping) and, consequently, the SSBs are also referred to as beams. These beams can be considered as micro sectors that further split the macro sector of the complete cell—typically 120-degree azimuth coverage—into smaller angular portions.6 Figure 1 illustrates the main transmission direction of seven SSBs of one cell on a map. The use of beamforming for synchronization signals and PBCH provides better overall coverage. Note that the direction of the beams can be two-dimensional in the sense that each SSB transmits into a specific azimuth and tilt angle.
Mobile Network Testing
Figure 1 also shows the route of a drive test, a method often used for MNT. The aim of the drive test is to measure the reception quality of the base station cells and their SSBs to determine network quality and coverage. The drive tests are also used to find interference, either from other cells or unlicensed deployments. Variations of conventional drive tests are walk tests, bike tests and drone tests, the latter requiring small passive receivers with low power consumption because of limited battery capacity.
MEASUREMENT SETUP
Sub-6 GHz Measurement Setup
Figure 2 shows the proposed measurement setup with a passive receiver or scanner, such as the R&S TSME6 mobile network scanner. Fed by an external antenna, the scanner measures the wireless signal from 5G FR1 and LTE cells, converts this signal into a digital baseband signal of I/Q symbols and sends it to a connected laptop for demodulation, analysis and presentation. The scanner contains an internal global navigation satellite system (GNSS) receiver to measure its geographical position, as well as receiving date and time information. For security reasons, the scanner itself is a passive receiver with no transmission capability. It can measure a baseband signal with a bandwidth of 20 MHz between 350 MHz and 6 GHz, the frequency range controlled by the measurement software on the laptop. The measurement software can be based on R&S ViCom, an open application programming interface, which enables custom scanner applications. Alternatively, ready-to-use software such as R&S Romes can be used.
FR2 Measurement Setup
The carrier aggregation framework in 5G NR allows complementary operation in FR2 with an FR1 carrier to ensure good coverage,1 requiring simultaneous SSB measurements in FR1 and FR2. Figure 3 shows the measurement setup for FR2. It requires a down-converter which converts the mmWave signal to an intermediate frequency below 6 GHz, so a single scanner with dedicated antennas can support simultaneous measurements in FR1 and FR2. One single scanner with one down-converter supports SSB measurements in FR2, and it is possible to connect several scanners with one down-converter, extending the baseband bandwidth to 100 MHz; however, this is not necessary for current applications.
CHALLENGE 1: HOW TO ANALYZE THE 5G NR SSBS?
Accessing or measuring a 5G NR carrier starts with discovering the center frequencies of the SSBs. In LTE, the PSS/SSS and PBCH signals are always transmitted around the center frequency of the carrier with fixed periodicity, making it possible to manually detect them in the power spectral density measured with a receiver. In 5G NR, however, the transmission characteristics of the SSBs are more flexible, creating new challenges to configuring a 5G NR receiver/scanner.
The most challenging problem is the flexibility regarding the SSB center frequency (SSRef). The 3GPP standard defines a frequency raster for the appearance of SSBs,4,5 but the raster is narrow with hundreds of possibilities within a 5G NR carrier. Further, a single SSB only appears for a short time, so it is difficult to detect the SSB with a traditional swept-tuned spectrum analyzer; the SSB periodicity is flexible with the frame starting point and its corresponding period: 5, 10, 20, 40, 80 or 160 ms.12

Figure 4 Measured arrival times and channel impulse response of SSB indices 0 and 2 for two cells.
To avoid time consuming spectrum scans, wrong scanner configuration or simply guessing the correct SSB center frequency, the proposed receiver/scanner solution is detecting the SSRef using an algorithm called Automatic Channel Detection (ACD). ACD can search quickly through large frequency ranges, where it runs an internal spectrum scan and searches for SSBs.13 ACD delivers the correct SSRefs within seconds, enabling the scanner to analyze both in-band and out-of-band, i.e., competitor networks where the cellular network parameters are completely unknown.
The ACD algorithm first provides a list of the SSB center frequencies; then, the scanner starts the SSB measurement algorithm (SSBmeas) for these frequencies. ACD can run in the background of the baseband processing, continuously searching for new SSB center frequencies. As soon as the scanner receives the signal of a base station cell strong enough for ACD sensitivity during a measurement, the corresponding SSRef will be scanned with the more sensitive SSBmeas for the remaining portion of the measurement. The ACD algorithm expects a 3GPP compliant 5G NR SSB transmitted on frames with an increasing system frame number. Internally, it uses the 3GPP band table to select the SSB transmission case for the selected frequency bands. This accelerates the ACD algorithm and avoids checking for unnecessary cases (e.g., Case E for band n1).
From the SSB measurement, many network features can be obtained to assess network quality, such as synchronization signal signal-to-interference-plus-noise ratio (SS-SINR) and synchronization signal reference signal received power (SS-RSRP).14 It is also possible to extract the cell identity (PCI), the SSB index, the channel impulse response and the arrival time for all detected cells and beams. SSB detection includes a decoding of the PBCH, preventing ghost codes, as the PBCH payload contains a cyclic redundancy check for error detection.