
Although antenna gain increases with frequency, surface imperfections will degrade the gain, also proportional to the square of the frequency. This change in gain can be estimated by Ruze’s equation:

where ΔG is the change in gain in dB and ϵ is the RMS surface imperfection.
It may seem that the higher antenna gain at higher frequencies can be used to reduce antenna size, but the higher gain is needed to overcome higher atmospheric loss. In dB, the FSPL can be expressed as

Equation 4 is the free-space attenuation calculation for point-to-point microwave transmission in the frequency bands permitted by ITU-R, from ITU-R P.525. Comparing the FSPL values for Ka-, V- and E-Band:
- For a 36,000 km geostationary (GEO) orbit at Ka-Band (27 GHz), the FSPL is 212 dB
- For the same GEO orbit at V-Band (50 GHz), the FSPL is 217 dB
- For the same GEO orbit at upper E-Band (86 GHz), the FSPL is 222 dB.
The E-Band FSPL is 5 dB greater than the value at V-Band and 10 dB above the Ka-Band level. To maintain similar link margins, one option is to increase the power of the PAs at both the ground station and satellite. Unfortunately, high-power E-Band PAs for ground gateways and commercial satellites are virtually nonexistent. With satellite power being a precious resource and ground-based PAs already as large as practical to minimize antenna size, other solutions are needed.
T&M COMPLEXITY
Generating wideband, digitally modulated signals at V-Band and above is challenging and typically requires multiple instruments. The latest signal and spectrum analyzers, like the Rohde & Schwarz FSW67 and FSW85, are the first to operate in V-Band (up to 67 GHz) or in E-Band (up to 86 GHz), respectively, without using external frequency conversion.
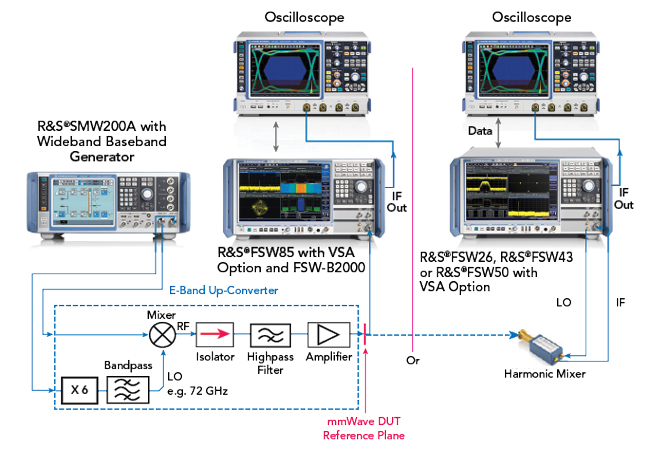
Figure 4 Test setups for E-Band component characterization.
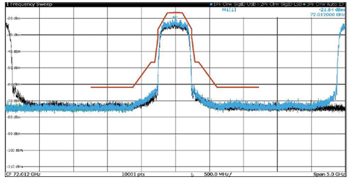
Figure 5 500 MHz bandwidth signal at 72 GHz, showing the image offset by 2.6 GHz.
One possible setup for E-Band signal generation and analysis for wideband satcom channels is shown in Figure 4. For E-Band signal generation, an up-converter using discrete components was employed, comprising a ×6 multiplier because of its commercial availability and other components operating at E-Band. Figure 5 shows a 500 MHz bandwidth E-Band input signal using the FSW signal and spectrum analyzer and the FS-Z90 harmonic mixer. The input and image frequency signals are 2.6 GHz apart. With this spacing, measuring the spectrum mask or analyzing modulation quality of wider bandwidth signals is straightforward. The bandpass filter after the multiplier must be chosen to eliminate the higher harmonics generated by the multiplier from appearing at the mixer local oscillator port, which will cause spurious signals in the up-converter’s output.
ONGOING R&D
E-Band satcom is becoming more suitable due to the growing demand for users to connect to the internet at higher data rates, which requires higher data capacity from commercial VHTS systems. Of the available satcom spectrum, E-Band offers the highest feasible data rates. This article has described some of the challenges to be addressed, such as the frequency plan, availability and performance of RF components and T&M complexities.
To evaluate the feasibility of E-Band for commercial VHTS systems, Hughes is investigating the following:
- Modeling links using commercially available and custom components
- Analyzing the RF conversation signal flow in the gateway and spacecraft
- Researching solid-state and traveling-wave tube PA technologies
- Researching antenna system requirements and design options
- Testing E-Band gateway and spacecraft links with modems to demonstrate link closure
- Characterizing wideband modulated signals suitable for high capacity links.
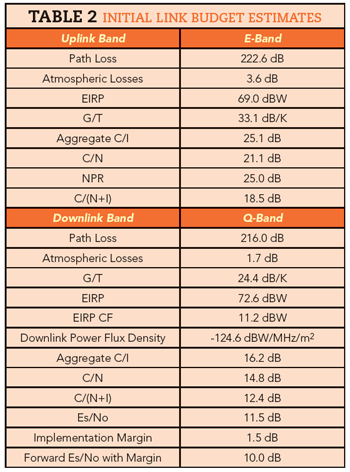
Table 2 shows a preliminary E-Band link budget. This is being refined as Hughes models the gateway and spacecraft forward and return paths and performs studies and benchtop tests with RF components from various suppliers. As noted, these studies are evaluating conversion schemes, various modulation and 1 to 2 GHz instantaneous bandwidth channels. Noise figure, output power, link gains and losses, phase noise, spurious, EVM and other communication system metrics are being measured, with the results used to update the link budgets and system architecture. Hughes plans to provide a future article for Microwave Journal readers, reporting on the results of these studies.
A natural question is, “What is the potential timeline for using E-Band for Tbps communications satellites?” Today, Hughes estimates five to 10 years based on the availability and viability of space-qualified E-Band components, supplier participation and leveraging benefits from terrestrial 5G systems.
References
- Y. Antia, D. Roos and S. Morrar, “The Hughes JUPITER System: Powering a Connected Future,” Microwave Journal, October 2019.
- Recommendation ITU-R P.618-12, “Propagation Data and Prediction Methods Required for the Design of Earth-space Telecommunication Systems,” July 2015.