
Radars not only receive echoes from the targets they detect, they receive echoes from surrounding objects such as trees, buildings and ocean waves. These incidental echoes, known as clutter, are of no interest and can impair radar performance. Signal processing in advanced radar systems detects and suppresses these unwanted reflections, by comparing the phases and amplitudes of successive echoes and displaying only moving targets, for example. The greater the phase and amplitude stability of the transmitted pulses, the better the results from signal processing. With high quality radar signals, any phase and amplitude variation can be assumed to be from the target, not from any instabilities in the transmitter. Thus, knowing the phase and amplitude stability of the transmitted pulses is crucial to assessing the sensitivity of a radar system to detect targets with a very small radar cross section, such as micro aerial vehicles. Power amplifiers (PA), in particular, can degrade stability, making precise measurement of the PA necessary to determine overall system sensitivity.
Complex Measurement, Simple Setup

Figure 1 The R&S FSWP phase noise analyzer feeds a pulsed signal to an amplifier, then analyzes the amplifier’s output.
Historically, high sensitivity measurements of the phase and amplitude stability of pulses required a complicated test setup with multiple instruments. A new option for the Rohde & Schwarz FSWP phase noise analyzer and VCO tester makes these measurements easy and straightforward. The R&S FSWP-K6P option is an enhancement to the R&S FSWP-K6 pulse measurement option, specifically intended to characterize pulse stability. The R&S FSWP-K6P option uses the FSWP hardware, which was designed with very low phase noise, capable of measuring phase and amplitude stability with higher sensitivity than a spectrum analyzer.
The R&S FSWP can generate pulses like a radar system, which feed the amplifier or other device being tested. The amplifier output is connected back to the R&S FSWP, which analyzes the signal. For this complex and highly sensitive measurement, the test setup could not be any simpler, as seen in Figure 1.
Theory
Since the phase noise of the local oscillator in the R&S FSWP and the generated pulses are identical or correlated, the phase noise can be suppressed, leaving only the phase change caused by the device being tested. This residual measurement has a sensitivity of less than -80 dB for pulse-to-pulse phase and amplitude stability. If the source in the R&S FSWP is not adequate for the application, the R&S FSWP offers users the flexibility to insert an external source as a local oscillator for the measurement.
The dB values for phase stability are calculated from the equation:
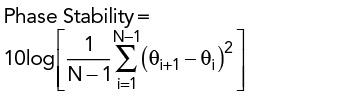
where θi is the phase at the sampling point of the ith of N pulses. An average pulse-to-pulse phase deviation on the order of 0.1 mrad corresponds to -80 dB. A similar calculation applies to amplitude stability.
Typical radar applications do not use simple pulses; they employ bursts or complex pulse sequences (see Figure 2). Consequently, burst signals are required to accurately test radar components, since components will heat up during the “on” portion of the burst signal, and this has a strong effect on the phase and amplitude stability. The R&S FSWP can generate pulse sequences and bursts, so the results reflect the performance of the device being tested under actual radar operation.

Figure 2 The burst signal consists of 10 pulses followed by a pause.
Output Presentation
With the R&S FSWP-K6P option, users choose whether to make measurements using the broadband spectrum analyzer or the more sensitive phase noise tester. With the latter, users can either measure the pulsed signal directly or employ the residual test mode using internally generated pulses to stimulate the device being tested.
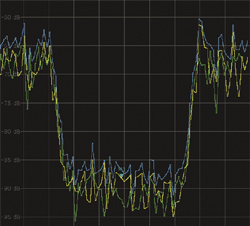
Phase and amplitude stability can be displayed for each individual pulse, with the deviation from the average at each sampling point in a pulse calculated and displayed. The R&S FSWP can average the values over an entire burst or calculate the difference between pulses, delivering pulse-to-pulse phase and amplitude stability. Both of these averaging techniques produce smoother, more instructive traces (see Figure 3).

Figure 3 Phase deviation from the average of each pulse for all recorded bursts (left). Pulse-to-pulse phase stability (yellow), amplitude stability (green) and sum of the two (blue) averaged over all pulses (right).
The better the amplitude and phase stability within a radar pulse, the more information a radar system can extract from the received signal. Making stability measurements with the required level of sensitivity used to be complex and costly. With the new option for the R&S FSWP phase noise analyzer and VCO tester, these measurements become easy and straightforward.
Rohde & Schwarz
Munich, Germany
www.rohde-schwarz.com