
 | |||
A spectrum analyzer is an important instrument for all RF/microwave engineers. Measurements of spectral purity, phase noise and spurious signals are everyday tasks for which a spectrum analyzer is the instrument of choice. Additionally, in today’s world of digitally modulated signals, modulation accuracy is a significant category of measurements that need to be taken. Error vector magnitude, rho and carrier leakage are important parameters but they cannot be measured by examining the spectrum alone. A vector signal analyzer is also needed.
The model FSQ26 signal analyzer has been specifically developed by Rohde and Schwarz to meet these requirements. It is a one-box solution that combines outstanding spectrum analyzer features and functions with a high performance, general-purpose vector signal analyzer that has a demodulation and analysis bandwidth up to 120 MHz. The operating frequency range is from 20 Hz to 26.5 GHz. Also, for engineers working with baseband, the instrument can be equipped with analog I and Q inputs, making it possible to analyze the signal quality before and after the RF stages.
Adjacent channel leakage of a WCDMA signal is one measurement where phase noise, sensitivity and intermodulation products all affect the performance of a signal analyzer. This new instrument has an inherent adjacent channel leakage ratio (ACLR) of 84 dB, and even with a four-carrier signal (see Figure 1), a value of 77 dB is achieved (with active noise correction).
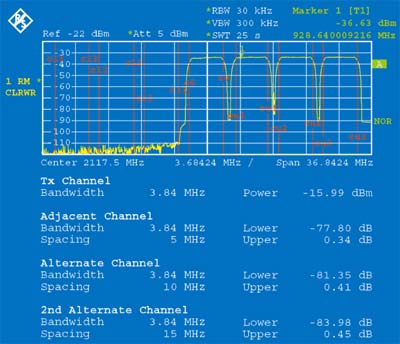 | ||
| Fig. 1 A screen shot showing the analyzer’s ACLR characteristics. | ||
A special feature of the vector signal analyzer is the new measurement function for determining the AM/AM and AM/PM conversion characteristic of amplifiers directly from digitally modulated signals. Thus, amplifiers can be measured under real operating conditions. Plus, transmission systems that are already installed can be analyzed for distortion by means of signal demodulation without affecting the transmission system.
Equipped with the Microsoft Windows® XP operating system, the FSQ26 analyzer can be configured like a PC workstation. Even simpler is remote control via the Ethernet, as it is equipped with interface libraries that link remote control programs to the instrument via a LAN as comfortably as via GPIB. These libraries provide direct access to measurement data from tools such as MATLAB.® Furthermore, the XP remote desktop can be used to interactively control the instrument via LAN.
Equalizing IQ Data
The design of the instrument is optimized for maximum accuracy, so digital equalization for the frequency response of the built-in filters as well as other components is performed. This ensures flat amplitude and phase response of the digitally recorded IQ data and results in a very low residual measurement uncertainty. Figure 2 shows an example of the contribution of the 20 MHz analyzer filter after equalization of the amplitude and phase distortion.
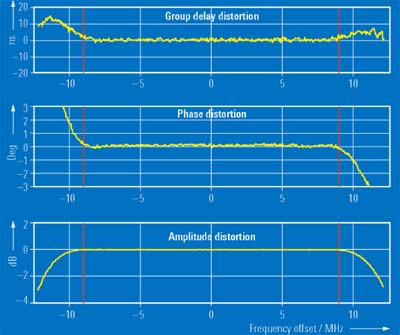 | ||
| Fig. 2 An example of the contribution of the 20 MHz analyzer filter after equalization of the amplitude and phase distortion. | ||
The integration of these digital correction filters into the signal processing chain is shown in Figure 3. It uses the common digital IQ baseband mixer, filtering, decimation of the data rate and, finally, the RAM for storing the complex samples. This basic structure has been expanded with the described equalizer and a digital resampler. The resampler stage performs a sampling rate conversion by a variable factor between 0.5 and 1. In combination with a second integer-based decimation stage for the data rate, the sampling rate for the output can be selected between 10 kHz and 81.6 MHz.
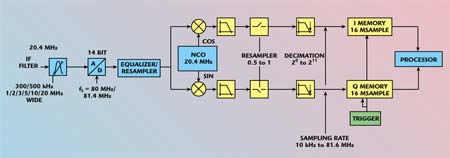 | ||
| Fig. 3 Integration of digital equalizer filters into the signal processing chain. | ||
The IQ baseband mixer is implemented in a proprietary gate array. The design has been optimized for very high signal dynamic and extremely small distortion products. For example, a memory depth of 16 Msamples allows 100 WCDMA frames to be recorded and later read out for external analysis.
Vector Signal Analysis
The firmware option FSQ-K70 extends the application range of the spectrum analyzer to include the modulation error analysis of digitally modulated single carrier signals (PSK, MSK, FSK, QAM) with symbol rates up to 25 MHz. In addition to common parameters such as error vector magnitude (EVM) or phase error, the firmware option also provides a large set of functions such as statistical analysis (PDF, CDF) as well as spectral analysis of measurement errors.
More than 40 measurements per second can be achieved due to the parallel operation of the gate arrays for data acquisition, the floating-point signal processor for demodulation and the Pentium® processor for modulation error calculations. The measurement settings and IQ mappings for commonly used mobile radio standards are predefined and can be recalled with a single keystroke. Users can also expand the predefined set of mappings and filters with their own designs. The required tools for that purpose are available free of charge on the Rohde & Schwarz homepage (keywords: MAPWIZ, FILTWIZ).
One of the most interesting innovations is the measurement of nonlinear distortion curves (PSK and QAM modulation) in a real-world environment. Traditionally, two-tone or multi-tone signals are used to characterize amplifier distortions. This method is relatively slow and has very little in common with the signals that the amplifier will operate with (for example, burst signals).
 | |||
| Fig. 4 An example of the AM/AM and AM/PM distortion measurement. | |||
During normal operation, the vector signal analyzer demodulates the measurement signal to a bit stream, from which an ideal IQ signal is recalculated. By comparing the measurement signal with this ideal IQ signal, amplitude and phase errors are evaluated for every sample. The interpolation of all these samples leads to the AM/AM and AM/PM curves. Figure 4 shows an example of a WCDMA signal (one code channel), where the upper half shows the measurement points and the distortion curves and the lower half the spectrum of the distorted signal. The nonlinearity of the amplifier leads to spectral re-growth into the neighboring channels.
The distortion curves are calculated during normal operation of the vector signal analyzer. In addition, the instrument also calculates values for the compression point, the crest factor, and the average power of the measurement signal and the ideal signal. The analysis of these values provides additional information on the amplifier’s dynamic performance. This novel measurement concept delivers results under real-world operating conditions and characterizes nonlinear effects much faster and more effectively than traditional methods. The application range also includes performance tests of amplifiers with active predistortion.
Wideband Demodulation
The instrument comes with a standard demodulation bandwidth of 28 MHz. For wideband applications such as satellite communication or radio link communication systems where the demodulation bandwidth of 28 MHz does not suffice, the FSQ-B72 option can be added. This option increases the demodulation bandwidth to 60 MHz when below 3.6 GHz and 120 MHz when above, and the symbol rates in the vector signal analyzer increase up to 81.6 Msymbol/s.
 | |||
| Fig. 5 An example of a modulation accuracy measurement of a cdma2000 signal. | |||
WLAN and Mobile Systems
For measurements on all major mobile standards and wireless LAN systems, the instrument functionality can be expanded with dedicated firmware packages. These packages not only include all the standard-compliant settings for measurements of in-band parameters such as modulation accuracy, frequency error or performance of power control, but also the correct limit lines for spectral measurements such as spectrum emission or power-versus-time masks. Figure 5 shows an example of a modulation accuracy measurement of a cdma2000 signal.
Specifications
With an analysis bandwidth of up to 120 MHz and an extremely wide dynamic range, the analyzer meets all requirements of newer transmission systems. This is evident from the sensitivity (–155 dBm at 2 GHz and a 1 Hz measurement bandwidth), dynamic range (25 dBm TOI at 2 GHz) and phase noise (–160 dBc in a 10 MHz carrier offset and 1 Hz measurement bandwidth) of the RF characteristics. With a linearity of < 0.1 dB over a 70 dB range and digitally implemented filters, the instrument achieves a total level of uncertainty of < 0.3 dB.
Conclusion
As can be seen, the model FSQ26 signal analyzer is the workhorse for every RF/microwave engineer, combining high end spectrum analysis, a wealth of functionality and high performance vector signal analysis.