

Direct microwave conversion utilizing extremely high speed analog-to-digital converters (ADCs) and digital-to-analog converters (DACs), enable systems with increased bandwidth, more capabilities and better performance. X-Band DACs can drive radar arrays directly or through single-stage up-conversion, which adds near real-time beam steering and nulling capabilities. ADCs can sample microwave signals directly, improving bandwidth and real-time analysis. ADCs and DACs only exhibit phase noise contributions from the noise floor and 1/f noise. However, if maximum system performance is required, this places quite a burden on the phase noise requirements of the oscillator.
This article provides a summary of the oscillator types available for local oscillator (LO) generation, or clocking, at X-Band frequencies and above, along with the best applications for each type of oscillator. These technologies can also be combined in a multi-oscillator approach to achieve both short-term and long-term stability requirements. A phase-locked loop (PLL) is required in these system architectures but an in-depth analysis of PLLs is outside the scope of this article. A good overview of what to consider when selecting phase-locked oscillators is in the reference section.1 The phase noise plots presented in the article come from multiple sources and vendors. They are meant to provide a qualitative comparison of high performance representative devices.
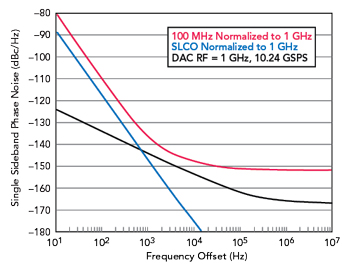
Figure 1 Single-sideband phase noise versus frequency.
Figure 1 is a plot of the residual phase noise of a 10.24 GSPS high speed DAC with an output at 1 GHz. This phase noise profile is compared with a high-quality 100 MHz oven controlled crystal oscillator (OCXO) that is ideally multiplied to 1 GHz and a sapphire-loaded cavity oscillator (SLCO) from Saetta Labs that is ideally divided from 8 GHz to the 1 GHz output. This result is normalized to show the performance of the DAC if it were ideal. The total noise will be the RSS of the oscillator and DAC. The curves show that this new generation of DACs has exceptionally low phase noise, but a careful choice of LO generation is critical to achieve the desired performance.
DATA COMMUNICATION SYSTEMS AND RADAR
High data rate communications systems and radar applications have significantly different phase noise requirements. Two important requirements for communications systems are long-term stability for signal acquisition and tracking, along with good phase noise performance at frequency offsets from the carrier where most of the data information is contained. Offsets in the frequency range from 20 kHz to > 50 MHz may be of the most interest to optimize.
By contrast, radar has more stringent phase noise requirements for the low- to mid-frequency offsets. Tracking radars measure the Doppler shift of an incoming target in addition to time-of-flight ranging. Airborne targets may be traveling at rates from subsonic to hypersonic speeds. Using an 8 GHz X-Band radar as an example, a target traveling at 5x the speed of sound, or approximately 1700 m/s at sea level, has a received Doppler shift of about 95 kHz offset. A target moving at half the speed of sound has an offset of about 10 kHz and a slow-moving target or lower frequency radar, would want to be optimized for phase noise at less than 10 kHz offset.
STABILITY AND PHASE NOISE
The usefulness of an oscillator links strongly to a single performance attribute: stability. Stability is broadly categorized into short-term and long-term stability metrics. Long-term stability is described in terms of drift, measured in parts per million or parts per billion and it may also be characterized by a metric known as Allan deviation. Short-term stability is phase noise. The crossover point between categorizing stability as long-term or short-term is typically around one second. The difference between short-term and long-term stability is analogous to the differentiation between precision and accuracy.
Long-term stability is accuracy. If the frequency of an oscillator is measured every second over an hour, a day, a week or a month, the repeatability and accuracy of the frequency is typically quantified as Allan deviation. This is a measurement of stability in parts per million (ppm) or parts per billion (ppb). In most systems, this is dominated by a quartz crystal oscillator with a typical reference frequency of 10 MHz. This 10 MHz frequency may be locked to a very accurate source. This is typically accomplished with a frequency-locked loop that locks directly to an atomic clock reference or to GPS, which indirectly locks to an atomic clock.
Short-term stability is precision. It is a measure of the oscillator phase repeatability over a short period. This is measured as phase noise. Phase noise theory is another subject that cannot be addressed comprehensively in this article. Simply put, phase noise is a power spectral density at a frequency offset from the carrier relative to the carrier power. It can also be viewed as the probability of phase fluctuations from ideal.
The preceding discussion has been theoretical, but there are practical implications. A microwave LO designed to drive a DAC or an ADC must strike a balance. It is typically a combination of a high frequency oscillator with good phase noise or short-term stability phase-locked to an oscillator with good long-term stability or drift.
OSCILLATOR FUNDAMENTALS
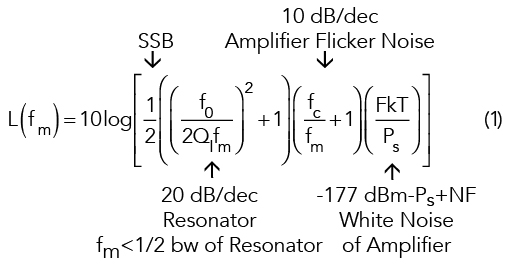
To a first order, an oscillator fundamentally has only two components that contribute to and affect phase noise and short-term stability. These components are the amplifier and the resonator. Control tuning circuitry and thermal performance are also contributing factors, but they are second-order. Thermal performance is a significant issue for a long-term reference. Leeson’s equation, shown in Equation 1, is a relatively simple equation that describes the phase noise of an oscillator based on amplifier and resonator parameters. There is an excellent summary of some of the work in this area in the reference section.2
Where:3
f0 is the output frequency
Ql is the loaded quality factor
fm is the offset from the output frequency (Hz)
fc is the 1/f corner frequency
F is the noise factor of the amplifier
k is Boltzmann’s constant in joules/kelvin
T is the absolute temperature in kelvin
Ps is the available power at the sustaining amplifier input.
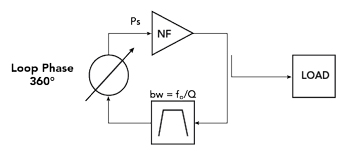
Figure 2 Oscillator block diagram.
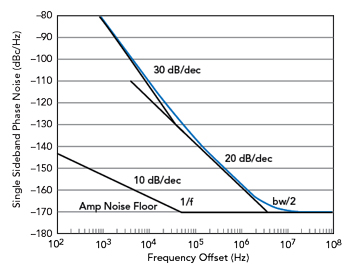
Figure 3 Phase noise plot of Leeson’s equation.
Figure 2 shows a generic oscillator block diagram. The phase shifter satisfies the oscillator stability criteria of a positive feedback loop at 360 degrees. The oscillator operates in a compressed amplifier state when the open loop gain is assumed to be greater than one. From Leeson’s equation, the phase noise is dominated by the Q-factor of the resonator.
Leeson’s equation can be separated into independent contributions from the amplifier and the resonator, as shown in Equation 1. The two last terms, as indicated in Equation 1 apply to the amplifier. The term, FkT/Ps defines the signal-to-noise ratio of the amplifier and the noise floor. This quantity can be measured independently and under oscillation with a typical value of around 3 dB in compression.4,5 The first term of the amplifier portion of Lesson’s equation is the 1/f noise. Different technologies have different 1/f corner values, but most X-Band oscillators will use a SiGe, GaAs or InGaP HBT process with 1/f corner frequencies between 10 kHz and 100 kHz. The loop is multiplicative, so all the amplifier noise is multiplied in positive feedback with the resonator. The noise floor of an amplifier can be estimated by taking the single-sideband PM noise floor due to thermal noise, which is -177 dBm, then subtracting the input power and adding the NF.
As an example, a medium power amplifier with 14 dB of gain, 16 dBm of output power and an NF of 5 dB results in a Ps, the input power to the amplifier in a compressed state of about 5 dBm, assuming 3 dB compression. In practice, the NF typically increases by a few dB under compression, so the assumption is that the NF increases to 8 dB. Plugging in these values (-177-5+8) yields a -174 dBc/Hz noise floor, which is the thermal noise floor in a 50 Ω system. This means that each oscillator is bound by the same amplifier condition theory and the noise floor will be similar among all oscillators.
The first term in Leeson’s equation, shown in Equation 1, relates to the resonator. Resonators have a particular loaded Q-factor that depends on the technology choice and integration. The equation can be rewritten to show the f0/2Ql term is the half bandwidth frequency of the resonator and the resonator does not affect the noise at offsets greater than this frequency. At higher offsets, the only noise contribution comes from the amplifier. At frequencies below this half bandwidth frequency, the term follows a second-order system and it can be shown as a Bode diagram increasing at 20 dB per decade.
Phase noise is a single-sideband measurement, so half the power is taken. Figure 3 is Leeson’s equation as a phase noise plot with the values of a typical dielectric resonator oscillator (DRO). The properties of each component of Leeson’s equation are shown graphically. The amplifier is plotted separately on the bottom and then summed on a log scale with the resonator for the total phase noise. The phase noise plot identifies the 20 dB per decade phase noise characteristic of the resonator, along with the 30 dB per decade sections that result when the 1/f and resonator phase noise profiles overlap due to the multiplicative effect of the positive feedback loop. From this chart, Q, noise floor and 1/f can be estimated for any oscillator.