
With higher frequencies, the integration of antennas and RF electronics means that many measurements now must be performed over the air. This article addresses the challenges of testing integrated antenna systems in e.g. phased array, antenna-on-chip and antenna-in-package configurations. This article details the latest over-the-air (OTA) measurement techniques for metrics such as noise figure, out-of-band emissions and radiated power spectral density.
INTEGRATION OF ANTENNAS AND RF ELECTRONICS
An ongoing trend in the mmWave regime is towards highly integrated wireless system designs. These efforts are being undertaken to reduce costs and increase efficiency. This integration often means that the antenna and the RF electronics cannot be separated, creating a new dimension in testing RF front-end performance.

Figure 1 30 GHz monopole antenna integrated with an LNA bonded to an evaluation board.1
Some of the most integrated designs involve antennas-on-chip or antennas-in-package, which are becoming especially popular in high frequency applications, such as automotive radar. Figure 1 shows a 2 × 1 mm, 30 GHz monopole antenna integrated with a low noise amplifier (LNA) in SiGe BiCMOS technology. This integration has the added benefit of co-designing the impedance of the LNA and antenna to optimize efficiency and noise figure, but a challenge lies in the manufacturing and testing of such a system.
Traditionally, LNAs are measured on a wafer probe station using conducted techniques. However, with this new configuration, there is no straightforward port available to feed RF power to the input of the LNA for a traditional conducted method. Since the antenna is the only port that is connected to the LNA, it is evident that characterizing the electronics in this system requires OTA methods. This motivates a reassessment of measurement techniques to determine the best way to evaluate the noise figure, system gain and compression point for such a system.
PHASED ARRAY ANTENNAS
These challenges become even more complex when using phased array configurations. If multiple antennas operate nearby, RF power is coupled from one element to another, as depicted in Figure 2. The mutual coupling between the individual antenna elements will alter the load impedance for different scan angles and therefore interact with the power amplifiers (PAs) in a transmitting system. Similarly, the coupling changes the source impedance of LNAs for different scan angles in a receiving system. This means that when the array is used to perform beamforming, the loading conditions change, impacting the array’s performance for each beamforming setting.

Figure 2 Mutual coupling in an antenna array.

Figure 3 Simulation results including simulated PAE circles.2
An example of the impact of beamforming is shown in Figure 3. The figure shows the active impedance of a Ka-Band stacked patch antenna connected to a PA in an infinite array environment for different scan angles of 0 to 70 degrees in the E- and H-planes.2 Under different beamforming conditions and frequencies, the active impedance changes significantly. Consequently, this can cause a reduction of over 10 percent in power-added efficiency (PAE). Similar effects occur in receiving systems that can impact the noise figure accordingly.
This simulation assumed that all paths are identical and that all relevant RF parameters like material loss, dielectric constant and surface roughness, are known. In addition, there will be differences between the paths, and antenna elements on the edge of a finite array will be affected differently as compared to the center elements. Manufacturing tolerances must be considered at mmWave frequencies. The unpredictability of all these effects can make the deviations in efficiency and noise figure even larger between simulation and measurement. Testing many different settings becomes essential to understanding the overall performance of the system and the only way to do so for RF electronics with integrated antennas is OTA.
TRADITIONAL OTA TESTING METHODS
Typically, OTA testing is performed in an anechoic chamber, which is known for its ability to precisely determine the direction of radiation as it measures one direction at a time. The radiation in all other directions is ideally absorbed by RF absorbers on the chamber walls. For many metrics, like ACLR, P1dB, system gain, out-of-band emission and noise figure that relate to an overall radiated power spectral density, a full sphere needs to be sampled and this is a time-consuming process. Often, a measurement at a single angle is performed. This inherently includes the antenna gain and can lead to measurement errors.

Figure 4 Possible measurement errors when measuring a single direction.

Figure 5 ANTENNEX reverberation chamber.4
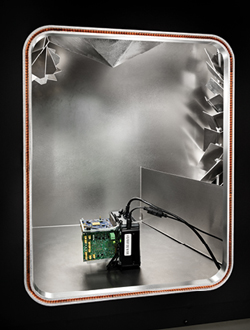
Figure 6 Pharrowtech 60 GHz PTK1060 and mode stirrers.5
Some sources of measurement error in a single direction are visualized in Figure 4. This figure shows a simulated normalized array radiation pattern for a 16-element linear array pointed towards 25 degrees. The direction of the maximum radiation is generally not known, a priori and precise alignment is not trivial. The main lobe is likely missed when measuring only one direction. A misalignment as small as 3 degrees results in a 2 dB error, as indicated by the dashed arrow in Figure 4. Additionally, it is insufficient to measure some metrics in only one direction. This is the case with harmonics. Figure 4 shows the second harmonic and with the same phase shift as the carrier frequency, the radiated power is assumed to be 20 dB lower. Since the harmonic is twice the frequency, the beam is steered in a different direction. This makes it important to perform a full spherical scan and sample very densely around the device under test (DUT), to ensure that all contributions are captured. This is obviously a very time-consuming task.
REVERBERATION CHAMBER
An alternative for OTA testing is the reverberation chamber, shown in Figure 5, which acts as the dual of an anechoic chamber.3,4 The reflective walls of the reverberation chamber ensure that radiation in all directions is captured, which reduces risk in the measurement process. The sensitivity to positional sampling and the issue of missing the second harmonic illustrated in Figure 4 is eliminated. Unlike spatial sampling in anechoic chambers, sampling in a reverberation chamber involves changing the environment around the DUT. This method requires significantly less sampling compared to a spatial scan, reducing measurement time. This method results in accurate and fast OTA measurements for RF electronics in integrated antenna systems, including the transition to the antenna, making it particularly valuable for mmWave tests. As an example, a radiated power spectral density measurement of a 60 GHz integrated antenna module across a 1 GHz bandwidth with 1 MHz resolution takes just 15 seconds, with less than 0.4 dB measurement uncertainty. The downside to this method is that extracting the radiation direction is more complex due to the highly reflective environment.
SETTING UP THE CHAMBER
The reverberation chamber works by mode-stirring, which means altering the electromagnetic environment within the chamber. This process involves mode stirrers, which are complex metallic shapes designed so that a small movement can create a significant change in the field distribution within the chamber. The mode stirrers can be seen in the chamber shown in Figure 6, along with the Pharrowtech 60 GHz PTK1060.
When measurements are performed over more than 100 different mode-stirrer positions, the field distribution within the chamber is, on average, uniform and isotropic. Increasing the number of measured positions of the mode stirrers reduces measurement uncertainty. The uncertainty due to the number of mode-stirrer positions is typically on the order of  where N is the number of different positions of the mode stirrers. These positions need to be carefully chosen such that the measured samples have a low correlation between them.

Figure 7 Ideal reverberation chamber for (a) receiving and (b) transmitting DUT.
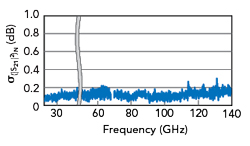
Figure 8 Standard deviation of reverberation chamber measurements.
Having a uniform field inside the chamber makes the measurement essentially independent of the positioning of the DUT. This is particularly advantageous at mmWave frequencies because it simplifies the measurement procedure and reduces measurement uncertainty. In a sense, the reverberation chamber is the OTA equivalent of a coaxial connector, acting as an integrating sphere for transmitting devices and uniformly illuminating receiving devices from all directions, as shown in Figure 7. This capability allows for rapid and accurate measurement of all the metrics related to the overall received or transmitted power.
To demonstrate the DUT positioning independence, transferred power through the chamber 〈|S21|2〉N was averaged over N=100 mode-stirrer positions at nine different antenna locations. Each measurement was taken on a different day with a new calibration. The standard deviation between all measurements is on the order of 0.1 dB at 26 GHz and only 0.2 dB at 140 GHz. This data is shown in Figure 8 and it shows the precision and operational bandwidth of the reverberation chamber.
CHAMBER LOSS CALIBRATION
Chamber losses for a regular setup are on the order of 25 to 40 dB in the 26 to 100 GHz range. This loss is comparable to the reduction in received power in a line-of-sight measurement at the same frequency range in an anechoic chamber with 20 dBi antennas at 2 m. Like anechoic chamber measurements, the losses in the reverberation chamber often need to be measured and de-embedded.
The characterization of the chamber loss is typically a separate measurement. This measurement is generally performed with a vector network analyzer connected to two reference antennas and needs to be performed for every new DUT because the DUT imposes different loading conditions on the chamber. Since many measurements can be performed using a spectrum analyzer, multiple instruments are often required to perform a measurement and the setup must be manually rebuilt between measurements. To overcome this issue, the ANTENNEX reverberation chamber contains an integrated signal generator that acts as a calibration module to characterize and calibrate chamber losses. For a transmitting device, the same spectrum analyzer configuration can be used for the chamber loss calibration and the measurement of the DUT without any setup alterations.
RADIATED POWER SPECTRAL DENSITY MEASUREMENTS
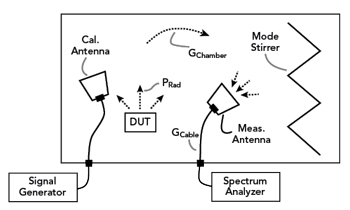
Figure 9 Typical total radiated power setup in the chamber.
Measuring the radiated power spectral density is straightforward when the chamber is set up and calibrated.6 Figure 9 illustrates a typical setup. The DUT transmits a modulated or CW signal that is attenuated by the chamber losses. A receiving antenna with a spectrum analyzer receives the signal. The radiated power spectral density (PSD) can be calculated using the simple link budget analysis (in dB) shown in Equation 1:
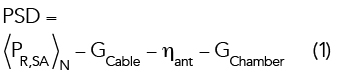
Frequency-dependent losses from the chamber, cables and antenna can be measured and calibrated as mentioned earlier. In Equation 1, 〈PR,SA〉N is the received power at the spectrum analyzer averaged over N mode-stirrer positions. A similar procedure can be used to characterize a DUT in receiving mode when the device has a detector, like an analog-to-digital converter (ADC), integrated or when it has an RF output.
In a reverberation chamber, the radiated PSD can easily be measured over a wide frequency band in less than a minute. This enables tests of metrics like out-of-band emissions, spectral regrowth, efficiency, system gain and more for many beamforming settings. This capability creates many possibilities in electromagnetic compatibility testing where the reverberation chamber has long been a staple for measurements below 18 GHz. For instance, it allows the characterization of radiated emissions from an RFIC that is not intended to radiate harmonics from lower frequency antenna systems.
In this example, the DUT is a standalone. Often DUTs need different inputs like data, RF or DC power. To enable all these inputs to the DUT, a dedicated panel that can be equipped with different feedthrough components is placed inside the chamber.
MANAGING REFLECTIONS
The reverberation chamber is a highly reflective environment, making it inevitable that a portion of the power returns to the antenna. When the antenna is properly positioned, the power returning to the DUT is the radiated power at a given frequency minus the chamber loss. When that power level is too high, the chamber loss can also be increased by loading the chamber with RF absorber. This will impact uniformity, but this can be compensated by measuring at different antenna locations.
Incorrect antenna positioning can cause high-magnitude reflections to return to the DUT, potentially affecting the device’s performance. This condition is similar to the effects of mutual coupling, especially when the main beam is pointed towards a wall or a corner. To address this, the ANTENNEX chamber has mode stirrers that are optimized to reduce direct reflections. As seen in Figure 6, there is a scattering structure located at the top of the chamber. When the antenna array is directed upward, the scattering structure minimizes reflections directly back to the DUT. The antenna should also not be placed too close to the chamber walls or mode-stirring mechanisms, as objects close to the antenna can change the impedance and reduce its efficiency.
THE REVERBERATION CHAMBER AS A WIRELESS NOISE SOURCE

Figure 10 OTA noise figure measurements in a reverberation chamber.

Figure 11 OTA noise figure measurement.
The ability to create a uniform field in the chamber can also be used to create different noise power levels. This means that the chamber acts as a wireless noise source.7,8 Similar to a conducted Y-factor method, a receiving DUT can be exposed to both hot and cold noise powers. An example of a setup for OTA noise figure measurements using the chamber is illustrated in Figure 10. By measuring the noise power at the output of the DUT with an internal ADC or with a detector connected to an RF output, the noise figure can be estimated.
This measurement also requires calibration of the chamber with an additional receive antenna, which is used to estimate the hot and cold noise power levels. In this calibration, the noise figure and gain of the detector are removed with a conducted Y-factor method. A measured result of a single antenna with an attenuator and an LNA is shown in Figure 11, which shows good agreement with a conducted reference.
CONCLUSION
Higher levels of integration in mmWave systems increase testing complexity. Reverberation chambers enable fast and accurate measurements of various metrics linked to both RFICs and antennas. This makes these chambers a valuable tool in the toolbox of both antenna and RF electronics engineers. By utilizing the reflective properties of a reverberation chamber, measurement time can be greatly reduced for several types of OTA measurements compared to traditional approaches. The inherent broadband behavior of the metallic walls and mode stirrers allows low uncertainties to be achieved over a wide bandwidth. By containing the radiation inside the reverberation chamber rather than the walls of the anechoic chamber absorbing a large portion of the energy, all the radiated information remains inside the chamber. This opens a realm of possibilities in other areas, like assessing the baseband signal quality with error vector magnitude measurements or measuring radiation patterns.
ACKNOWLEDGMENTS
The authors would like to thank Tim Stek and Roel Budé from ANTENNEX B.V. and Martijn de Kok from the Eindhoven University of Technology for contributing to this article.
References
- Z. Chen, Q. Liu, B. Smolders, P. Baltus and H. Gao, “30-GHz Co-designed Low-Noise Amplifier and Antenna-on-Chip for Wireless Applications,” IEEE International Symposium on Radio-Frequency Integration Technology (RFIT), Nanjing, China, 2019, pp. 1–3, doi: 10.1109/RFIT.2019.8929159.
- M. de Kok, S. Monni, M. van Heijningen, A. Garufo, A. B. Smolders and U. Johannsen, “A Review of PA-Antenna Co-design: Direct Matching, Harmonic Tuning and Power Combining,” 52nd European Microwave Conference (EuMC), Milan, Italy, 2022, pp. 536–539, doi: 10.23919/EuMC54642.2022.9924344.
- A. Hubrechsen, K. A. Remley and S. Catteau, “Reverberation Chamber Metrology for Wireless Internet of Things Devices: Flexibility in Form Factor, Rigor in Test,” IEEE Microwave Magazine, Vol. 23, No. 2, Feb. 2022, pp. 75–85, doi: 10.1109/MMM.2021.3125464.
- The Wireless ConnectorTM, ANTENNEX B.V., Web: www.antennex.tech.
- 5.PTK1060 EVK, Pharrowtech, Web: www.pharrowtech.com.
- A. Hubrechsen et al., “Total Radiated Power Measurement at 100 GHz in a Reverberation Chamber,” 17th European Conference on Antennas and Propagation (EuCAP), Florence, Italy, 2023, pp. 1–4, doi: 10.23919/EuCAP57121.2023.10132953.
- A. Hubrechsen, T. Stek and A. B. Smolders, “Simplified Over-the-Air Noise Figure Measurement Method for Reduced Uncertainty,” IEEE/MTT-S International Microwave Symposium - IMS 2023, San Diego, Calif., 2023, pp. 911–914, doi: 10.1109/IMS37964.2023.10188197.
- T. Stek, A. Hubrechsen, D. S. Prinsloo and U. Johannsen, “Over-the-Air Noise Figure Characterization of mm-Wave Active Integrated Antennas Using a Reverberation Chamber,” IEEE Transactions on Microwave Theory and Techniques, Vol. 71, No. 3, March 2023, pp. 1093–1101, doi: 10.1109/TMTT.2022.3217149.