
RELIABILITY MEASUREMENT PROCEDURE
Unfortunately, no clear guidelines have been published for evaluating the reliability of a blind mate interconnection. Using the IEEE 287 standard as a guide and considering available resources, a reliability test plan was developed (see Figure 7) using a set of 14 connectors. Ten connectors were used for a docking cycle test to the maximum number of 60,000 insertion cycles. S-parameters were measured after every 300 cycles, and the connectors were removed to perform optical and mechanical measurements after every 6,000 cycles. Due to measurement resource limitations, only two interconnects were tested in parallel.

Figure 7 Connector reliability test plan.

Figure 8 Interior of connector pair at 0, 30,000 and 60,000 mating cycles.

Figure 9 Measured |S12| of connector 5, measured every 300 cycles from 0 to 60,000 cycles.
To eliminate the possibility that individuals in a pair become adapted to each other across the test run, after every 6,000 cycles, the female of the pair was exchanged between the two connectors being tested in parallel. This is important because if the same male and female sides of the interconnect remain the same, the measured reliability results are significantly better. With no regular connector exchange from the set of connectors tested, 100,000 cycles were reached with acceptable electrical performance in one tested interconnect.
In a real application, different test fixtures are connected to different ATE systems through the lifetime of the connector, which must be considered in reliability testing to avoid unrealistic results. Unfortunately, a significant number of connector vendors still perform reliability testing with the same interconnect pair to show better reliability.
Two other connectors were stressed to 60,000 cycles; in this case, only contact resistance measurements were performed every 300 cycles. Similarly, the same physical measurements and female connector exchange was performed every 6,000 cycles, as previously described.
Finally, the remaining two connectors in the measurement set were subjected to an accelerated life test, where they were left in a climatic chamber for 72 hours at 85°C and 85 percent humidity followed by the 60,000 docking cycle test, with S-parameters measured every 300 cycles.
MEASUREMENT RESULTS
The reliability testing strategy shown in Figure 7 generates an enormous amount of data, which is summarized here. Mendes provides complete results with a significantly more detailed discussion.4
The S-parameter measurement setup consisted of an Anritsu MS4647B VNA and a 4-port extension MN4697B. The measurement cables were Megaphase RF orange 1.85 mm. The VNA was used without calibration, so the loss shown in the following measurements includes both coaxial cable and the VNA’s intrinsic loss. The reason for this approach to measuring interconnect performance is because the objective is measuring variations of interconnect performance over an increasing number of docking cycles, not the intrinsic connector performance. Not performing a calibration at the end of the coaxial connectors eliminated one possible variation when comparing S-parameter measurements across a testing cycle spanning several weeks.
Figure 8 shows the interior of one connector pair before the test, at 30,000 cycles and at 60,000 cycles, showing degradation of the socket side in the female of the pair. Figure 9 shows the measured S-parameters after 60,000 insertion cycles. Since S-parameter measurements were performed every 300 cycles, the graph contains 200 overlaid plots. After cycle 54,000, a resonance appeared in the measured insertion loss around 20 GHz, revealing a failure of the interconnect, even though it continued working at higher mmWave frequencies. The cause for the failures was a crack in one of the socket fingers (see Figure 10). This is the same mechanism seen with all failed connector pairs - not surprising since finite element mechanical simulation shows this point has the highest mechanical stress during connector mating (see Figure 11).4

Figure 10 Socket crack seen with SEM (a), optical microscope (b) and CT scan (c).

Figure 11 Finite element simulation showing the area of maximum mechanical stress during connector mating.
Although from a test and measurement perspective, electrical performance is the critical metric, the IEEE 287 standard defines several mechanical metrics, including the connector socket’s withdrawal and insertion forces.3 The measurement setup is defined in the standard and requires a custom designed pin. Figure 12 shows the measured results for one of the tested connectors after a highly accelerated life test (i.e., with elevated temperature and humidity) prior to cycle testing. From limited results with the measured test set, since only two connectors went through the highly accelerated life test, it appears the highly accelerated life test reduced interconnect lifetime by roughly 50 percent.

Figure 12 Concentricity and insertion/withdrawal forces for a connector with accelerated life testing prior to cycle testing.
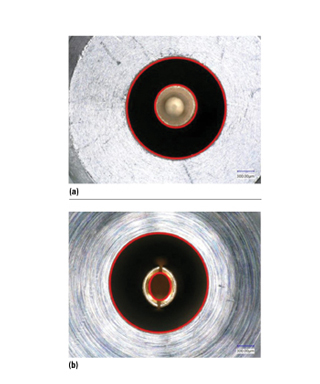
Figure 13 Pin (a) and socket (b) concentricity for a tested connector pair.

Figure 14 Measured |S21| and |S11| of one connector, showing no failures through 60,000 cycles.
Another important metric is concentricity.5 While concentricity at the interface, including socket closure, is not defined as a metric in the IEEE 287 standard,3 what is called out is the runout between the outer and center conductors. The authors’ opinion is concentricity at the pin and socket is an important metric. Concentricity is the difference between the center of the inner and outer diameters of the socket and pin. Figure 13 shows how concentricity is defined for one tested connector pair, while Figure 12 shows measured results for one connector. The two-slot socket acts as two springs that open and then apply force when the pin is inserted. Poor concentricity creates an uneven distribution of force that will wear out one tine faster than the other. Poor concentricity also displaces the conductors, creating force imbalances and early mechanical failure or plating wear, which can lead to possible corrosion and failure from poor conductivity.
Figure 14 shows the measured |S11| and |S21| for a connector with no resonance failures during the entire 60,000 cycle test. This measurement was done with a fully calibrated VNA before the start of the test and after the entire 60,000 cycles. The results show even after 60,000 cycles, measured insertion and return loss are still acceptable.
Another interesting measurement from the context of connector reliability is computed tomography (CT), since it enables nondestructive testing. X-ray based CT provides a 3D volume data set computed from several thousand X-ray projections of the rotating object. From this data set, the 3D geometry or surface of the object is extracted. In Figure 15 the surface of the original connector at cycle 0 is compared to the connector’s surface at cycles 12,000 to 60,000 by visualizing the deviation in microns of the connector surface compared to cycle 0. Resolution is in the range of single digit microns. The X-ray photon energy used for the CT scan was 225 keV. Mendes provides a more detailed discussion of the technique.4

Figure 15 CT scans on a female interconnect every 12,000 cycles.
CONCLUSION
A reliability study of a blind mate 1.85 mm coaxial interconnect for ATE mmWave applications showed that the target of 20,000 insertions was achieved with a significant margin, since all the connectors in the study failed above 40,000 cycles, excluding the connectors that had the accelerated life procedure performed. This article includes only a subset of the results described by Mendes, which has a more detailed reliability analysis and estimation using Weibull and lognormal distributions.4
Mechanical finite element simulations confirm the failure mechanism is fatigue, showing increments of localized plastic deformation along the simulation. The calculated number of cycles to failure shows a reliability of around 100,000 cycles using COMSOL Multiphysics simulation software, based on the classical S-N curves.4 The difference between the predicted and experimental measurements is justified by S-N curve uncertainty and because the fatigue is multiaxial and of contact. While the calculation of the number of cycles to failure using fatigue models is far from a trivial exercise, it is a topic that should be investigated in the future.
We would like to highlight two of the important requirements for this interconnect system not included in the IEEE-287 standard: There is no applied force requirement for the connector interfaces (reference plane to reference plane). There is also no concentricity requirement at the pin and socket mating ends of the conductors.
Acknowledgments
We thank Kosuke Miyao, Andy Richter, Marc Moessinger and Matthias Feyerabend from Advantest for their support on this project, the Advantest failure analysis lab in Gunma, Japan, and Eric Gebhard from Signal Microwave. We also thank Professor Sven Simon and Peter Gaenz from the Department of Parallel Systems at the Stuttgart University for the CT scan measurements.
References
- J. Moreira and H. Werkmann, “Automated Testing of High-Speed Interfaces,” Artech House, Second Edition, 2016.
- B. Rosas, J. Moreira and D. Lam, “Development of a 1.85 mm Coaxial Blind Mating Interconnect for ATE Applications,” IEEE International Microwave Symposium, 2017.
- IEEE, “IEEE Standard for Precision Coaxial Connectors (DC to 110 GHz),” IEEE 287-2007, September 2007.
- A. J. Rodrigues Mendes, “Reliability Evaluation of a 1.85 mm Blind Mating Coaxial Interconnect for mmWave ATE Applications, Master of Science Thesis,” Instituto Superior Técnico, University of Lisbon, 2020. fenix.tecnico.ulisboa.pt/downloadFile/845043405507284/Final_Thesis_Antonio_81353.pdf.
-
Signal Microwave, “Microwave Connectors Basics,” signalmicrowave.com/
microwave-connectors-basics-presentation.pdf.