

As telecommunications standards have shifted to higher frequencies, such as mmWave, system designers have incorporated arrays of antennas into communication systems. These sophisticated arrays enable higher gain and smaller beamwidth patterns that can overcome the high path losses inherent at these frequencies, to deliver the higher throughput promised by these new standards. Even for small arrays with a few elements, fully understanding the coverage possible with different power and phasing combinations can be difficult. When arrays grow larger to contain tens or hundreds of elements, advanced tools are required to fully describe the operation and effectiveness of the design.
The latest release of Remcom’s xFdtd® Electromagnetic Simulation Software contains analysis tools for rapidly characterizing the performance of arrays of antennas for beamforming and beam steering applications. Superposition enables the rapid synthesis of complex problems using basic data from an electromagnetic (EM) simulation, quickly overlaying the data in a linear space.

Figure 1 Patterns of a 1 x 8 linear array (a) and two, 1 x 4 linear arrays (b) of patch elements, simulated using the superposition feature in XFdtd.
For example, consider multiple antennas in a problem space. The requisite data - S-parameters, efficiency and far-zone - are computed once in an EM simulation for each antenna of interest. These may be quickly combined with complex scaling to yield the radiation pattern and associated active S-parameters and efficiency for any desired antenna power and phasing combination. For situations where specific port power and phasing options are known, the resulting far-zone pattern can be computed immediately in post-processing.
A second situation is where the specific beam directions are known in advance, and the power and phasing of the ports is desired to maximize the effective isotropic radiated power (EIRP) in those directions. Using statistical analysis, the coverage provided by the array for all possible directions may be determined by calculating the cumulative distribution function (CDF) of the EIRP, which shows the percent of the spherical far-zone volume with positive gain for a given input power.
To illustrate, we consider a 1 x 8 array of 28 GHz patch antenna elements, where the phasing between elements is swept using the superposition feature from -90 to +90 degrees in 30 degree steps. Seven unique beams will be created, which focus a fan beam between -30 and +30 degrees (see Figure 1a). Alternatively, if the array is used in a configuration with two adjacent 1 x 4 subarrays, the superposition feature can be used to generate separate patterns for each subarray (see Figure 1b).
Alternatively, where the desired beam directions are known and the port settings are desired, an array optimization feature is available. A large, two-dimensional array, such as an 8 x 8 patch array at 28 GHz, will create narrow beams that can be swept over a broad range of directions above the array. Figure 2 shows the “max hold” pattern created with the array optimization tool, where the beams are desired at every 15 degrees in the azimuth direction and an elevation angle 30 degrees down from normal. Following the calculation, the required port power and phasing requirements for the elements to form each beam are available.
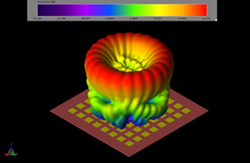
Figure 2 Patterns of an 8 x 8 array of patch elements, simulated using the array optimization tool in XFdtd.
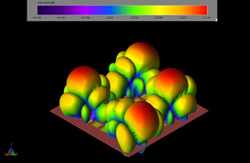
Figure 3 Patterns of an 8 x 8 array of patch elements structured as four 4 x 4 independent subarrays, simulated using the array analysis tools in XFdtd.
A large array may also be operated as a set of smaller subarrays functioning independently. Figure 3 shows the same 8 x 8 array configured as four, 4 x 4 arrays, each with their own unique power and phasing to communicate with four receivers. Using the array analysis tools, the subarrays are defined and their operating characteristics can be explored.
Multiple arrays on a single device are used for spatial diversity, to provide coverage over a wider range of angles - more than a single array could produce. An example of this is a 5G mobile phone incorporating multiple arrays around the edge of the phone. Figure 4 shows four arrays located on the sides, top and bottom of the phone case. Each are four element patch arrays that can produce a steerable beam covering a wide region normal to the array. When used in combination, the arrays can provide coverage in multiple directions, which is best demonstrated with the CDF of the EIRP. This one-dimensional function describes the percentage of the far-field sphere covered by an array for a given input power. In Figure 5, the CDF of EIRP is plotted for different combinations of the four arrays along the edges of the phone. The single arrays used individually provide positive gain for about 66 percent of the directions (i.e., 1–0.34 from the CDF plot), assuming a typical 23 dBm input power to each array. The coverage improves to about 90 percent when two arrays in one of the corners are used in combination, and full coverage results when the arrays on opposite sides of the phone are used together.

Figure 4 Four, 1 x 4 patch arrays distributed in a mobile phone to enable wide spatial coverage.
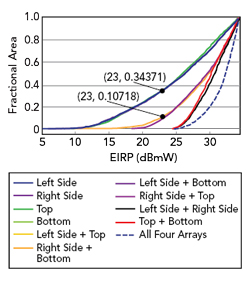
Figure 5 EIRP CDFs of the patch arrays in the mobile phone.
As device performance is pushed to new levels by the increasing demands of 5G mmWave systems, the need for more comprehensive analysis tools for complex antenna systems grows. xFdtd’s new features simplify the process of understanding device performance by providing efficient ways to analyze and validate array coverage.
Remcom
State College, Pa.
www.remcom.com
