
The main purpose of the DRFM system is to deceive the hostile sensor. This task is performed through several deception techniques. Proper design and programming require realistic simulations of the dense emitter environments in which DRFMs operate, with careful analysis of the signals transmitted by the system and comparison with the waveform generated by the hostile emitter. For this, Rohde & Schwarz offers several analysis tools for fast and repeatable results. These tools include a pulse analysis option with automatic pulse capturing and examination, transient signal analysis of signals with time-changing behavior, pulse Doppler waveform streaming to simulate the complex emitter environment and pulse stability analysis to ensure the jammer introduces no unwanted distortion.
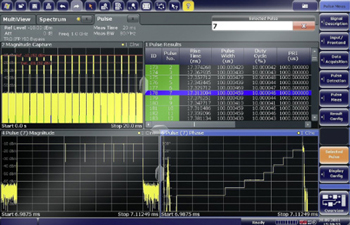
Figure 3 Screen shot of range gate pull-off.
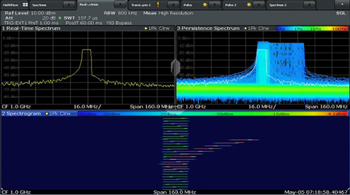
Figure 4 Screen shot of velocity gate pull-off.
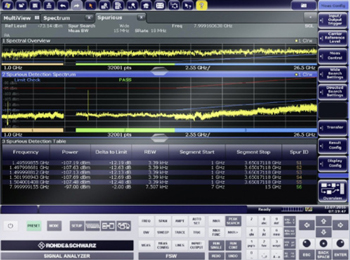
Figure 5 Spurious measurement.
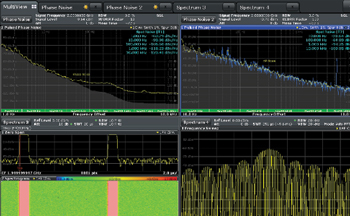
Figure 6 Phase noise measurement.
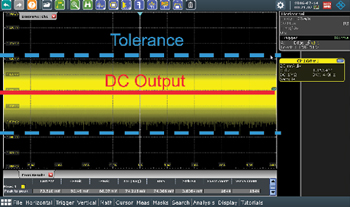
Figure 7 Power integrity measurement.
Figure 3 shows an example of an EA scenario where the jammer pulls off the radar range gate. All deception techniques are time-based and require careful synchronization of several parameters. The scenario is created with the pulse sequencer software, transmitted via a function generator, and analyzed with the R&S FSW K6 pulse measurements option. The range gate pull-off or capture and walk technique normally works with velocity gate pull-off (see Figure 4), where the jammer tries to pull off the Doppler gate.
Timing is essential for successful pull-off. If the pulse repetition interval (PRI) or Doppler is pulled off too fast or too far, it might leave the range or velocity gate and alert the radar that it is being jammed. Timing parameters of the PRI or Doppler walk must be carefully considered, so it is important to look at the trend of the selected parameter, which is available in the pulse analysis option. Complex analysis is simplified with a flexible and freely configurable user interface. To speed the measurement, most of the tasks are automated. Nevertheless, one can manually change and configure the setup to fit specific requirements.
Take, for example, the verification of the pulse train transmitted by a jammer in response to a pulse radar with pulse compression used to improve the time-bandwidth product, the range resolution or both. Capturing such a complex signal, modifying some of its parameters and playing it back without disturbing important factors such as phase, compression ratio or sidelobe level is not easy. To ensure that no additional disturbances are introduced by the jammer, one can upgrade the pulse analysis option with the R&S FSW K6S and automatically measure the compression parameters of the modulated pulse transmitted by the system. The main lobe versus sidelobe level and the time difference between them are summarized in a results table. The user can upload reference pulse waveforms in I/Q format and compare phase and frequency within a pulse with the measured values.
RF/IF STAGE TESTING
Spurious emissions ultimately determine jammer effectiveness. Unwanted radiation puts additional strain on the RF systems and acts as a beacon for ECCM. Normally, spurious emissions measurements are tedious, time consuming and expensive. To maximize the analyzer’s performance, engineers must manually adjust parameters such as resolution bandwidth and frequency. Using the R&S FSW K50 option, this task is simple: enter a few constraints, such as frequency range and desired spurious level. The instrument then performs the measurements automatically, indicating either a pass or a fail (see Figure 5). The complexity of the task is drastically reduced while the measurement speed is increased by up to 20x compared to the traditional, manual method.
Phase noise measurements are not simple; the more accuracy required, the more complicated the measurements become. With the R&S FSWP phase noise analyzer, however, complicated setups, such as pulsed additive phase noise, are accomplished in minutes with high accuracy (see Figure 6). This is also a fully functional spectrum analyzer and voltage-controlled oscillator (VCO) tester. If, for example, the DRFM is acting as a smart (follower) jammer on a hopping signal, then the user must characterize VCO tuning and settling.
Internal DC sources can be used for VCO characterization, providing all VCO parameters at a glance, such as frequency, current, power and sensitivity. Ensuring coherence between transmit and receive paths and the performance of stability measurements are essential parts of the DRFM developer’s toolkit. The R&S FSWP phase noise analyzer uses the Allan variance (AVAR) to analyze the time-domain stability of oscillators.
Pulse train stability of the jammer must also be considered. Too much jitter and the return could be filtered by the radar’s false alarm rate algorithm - or worse, classified as a jamming signal. Many factors affect pulse stability, for example, memory effects, mismatch between different stages, poor thermal dissipation planning and/or clock/oscillator jitter. The R&S FSWP provides an accurate way to measure phase and amplitude stability, helping optimize jammer design. Typical parameters are difference to average for both amplitude and phase, and 3D visualization makes it easy to spot potential problems.
The free space transducer will always be used, no matter how far digitalization progresses. Even with direct RF-to-digital conversion, an antenna plays the key role in transferring the RF energy to the desired destination. Here, the R&S ZNA vector network analyzer adds fast, non-dedicated receivers for antenna characterization with excellent receiver sensitivity.
DIGITAL STAGE MEASUREMENTS
Testing at the digital stage is as important as performing system level verification or qualifying RF components, sub-modules and modules. Among the key elements are power and signal integrity, clock jitter, latency, timing and qualifying the signal converting components, such as the ADC and DAC. On the digital side, the oscilloscope is the centerpiece of the test kit.
Power integrity tests ensure clean power and no additional coupling of noise or hum on the RF lines. Typical performance parameters are ripple, noise and power distribution network impedance (see Figure 7).
With deeper strides into the digital world, clock synchronization becomes critical. Imagine an active electronically scanned array architecture with thousands of transmit-receive modules, where a significant portion of the calibration time is spent on timing synchronization and clock calibration. Eliminating clock jitter at the design stage simplifies the calibration process in final testing and verification, ensuring a fully functional product.
ADC and DAC measurements are just as important. For the RF side, the R&S FSWP phase noise analyzer or the R&S SMA100B analog signal generator may be used. For the DAC side, testing signal quality, modulation quality and phase noise is common. For the ADC, general testing with CW and real test signals qualify the component for its intended purpose. Wideband tests can be performed with the 2 GHz baseband bandwidth of the R&S SMW vector signal generator. Two RF channels in the same R&S SMW instrument can be stitched together to provide a 4 GHz wide signal with optimal RF performance.
CONCLUSION
The DRFM jammer is an essential and highly complex element of the EA suite. It has evolved from a simple repeater with some fading capabilities to a sophisticated EA asset. Critical test areas involve the operation and timing of deception techniques at the system level, qualifying the individual components, submodules and modules at the RF/IF level and ensuring that clock jitter and power integrity are addressed early in the design stage.