
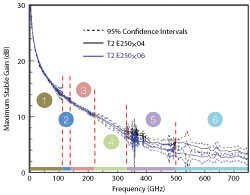
Figure 1 MSG measurements of THz transistors with 95% confidence intervals; measuring to 750 GHz requires six system reconfigurations. Data courtesy of Dylan Williams, NIST.
With significant expansion of emerging terahertz (THz) applications such as noninvasive spectroscopy, security and surveillance, short range automotive radar and 5G communications, the need for accurate, reliable and repeatable measurement data is crucial. This is especially true for the research and technology development of the devices, integrated circuits and new product building blocks serving the needs of THz applications.
This article discusses solutions to address the challenges of wafer-level calibration and measurements at THz frequencies. Solutions for measurement instrumentation, frequent system reconfiguration, operator skill affecting the accuracy and repeatability of calibration, and the need for metrology-level analysis of the measured data are described.
TEST INTEGRATION
Measurements at sub-THz frequencies usually require repeated and tedious system reconfiguration to switch between frequency bands. For example, the probe system and the vector network analyzer (VNA) have to be reconfigured and recalibrated six times to reach 750 GHz (see Figure 1). Characterizing a device under test (DUT) across frequency bands is becoming an extremely time consuming exercise. The conventional approach of mounting the sub-THz VNA frequency extenders on the probe system requires elevation of the chuck and microscope, which reduces the system’s mechanical stability. At the same time, increasing the measurement frequency demands extremely accurate positioning of the RF probes on the DUT contact pads and calibration standards. As a result, the accuracy and repeatability of the system calibration decrease exponentially with increasing frequency, and characterization of the DUT becomes a very challenging task.
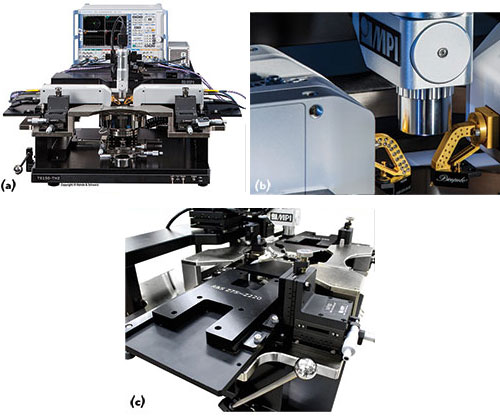
Figure 2 The MPI TS150-THZ integrated probe system configured for measurements to 330 GHz with the R&S ZVA VNA (a). GGB waveguide probes directly mounted at the output of the mmWave ZVA converters (b). Dovetail interface of R&S®ZVA-Z75 to R&S®ZVA-Z220 frequency converters (c). Photos courtesy of Rohde & Schwarz.
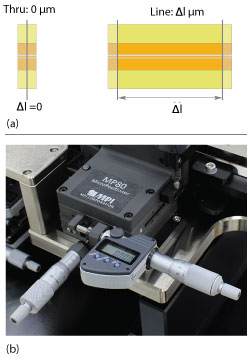
Figure 3 TRL definition of ∆l for line standards (a). MP80-DX micro positioner with the digital micrometer on the X axis (b).
A manual system such as the MPI TS150-THZ incorporates many features that address the challenges of wafer-level measurements at THz frequencies. These include seamless integration of any type of VNA frequency extender at any frequency band, to provide the maximum measurement dynamic range and reproducibility (see Figure 2a). This trade-off was resolved by combining the low profile and stable chuck Z-stage with the ridged probe platen resting below its surface. This allows direct mounting of THz RF wafer probes on the output waveguide port of the VNA frequency extenders (see Figure 2b), which maximizes measurement dynamic range. A dedicated dovetail interface of the VNA extenders holding plates makes swapping them easy (see Figure 2c). There is no need to unmount the interface plate from the extender. Due to its flat bottom, the interface and the VNA extender can be handled as one unit, located on the laboratory shelf or in a cabinet for later use.
WHY MULTILINE TRL?
The multiline thru-reflect-line (TRL) RF calibration method developed at the U.S. National Institute of Standards and Technology (NIST) has become the benchmark for metrology and industry laboratories focused on wafer-level RF measurements. Its key advantage over other calibration methods is the calculation of the calibration reference impedance, ZREF, based on measurement of the traveling waves propagating through the calibration planar line standard. Traveling waves are purely physical phenomena defined by the type and design of the transmission lines and are independent of the geometry and design of the RF probes. The multiline TRL algorithm enables accurate extraction of the propagation constant γ of the calibration lines. Therefore, the multiline TRL can set the measurement reference plane precisely and at an arbitrary position. The multiline TRL calibration kit can be designed and fabricated using the same semiconductor process as the DUT. Customized, on-wafer, multiline TRL calibration kits eliminate the need for de-embedding the DUT measurement results from the parasitic impedances of the device contact pads. With all these advantages, the multiline TRL is the only method that delivers trustable calibration results at frequencies above 110 GHz.
Three or more lines with different physical lengths should be used in the calibration to cover a wide frequency range. Together with the thru and reflection standards, the multiline calibration kit can include more than five elements. Measuring such a kit involves repeated readjustment of the micro-positioners and realignment of the probes to the contact pads to achieve repeatable measurements. It is often difficult to obtain accurate and repeatable multiline TRL calibration at millimeter wave (mmWave) frequencies on a manual probe system, especially if it is operated by several users with various levels of expertise. A system such as the TS150-THZ offers the option of an integrated digital micrometer that simplifies the calibration process. The TRL algorithm always treats the thru standard as a zero-length line. The effective length of each subsequent line standard, ∆l, is defined with respect to the length of the thru (see Figure 3a). The operator simply zeros out the digital micrometer after the initial adjustment of the probes, i.e., on the thru standard (see Figure 3b). Next, the distance between RF probes can be readjusted to the required value of Δl (see Table 1) with a precision better than 1 µm. As a result, the system improves the accuracy and repeatability of calibration—even for inexperienced operators—while reducing setup times.
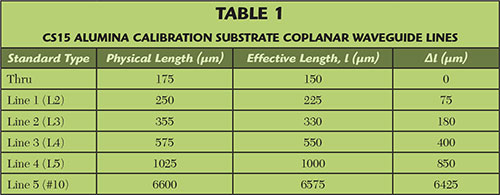
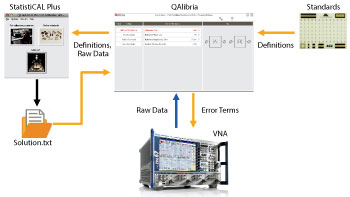
Figure 4 System calibration data flow.
NIST UNCERTAINTY FRAMEWORK
StatistiCAL™ Plus is a software package developed at NIST that realizes both conventional multiline TRL and calibration solutions based on the orthogonal distance regression. The algorithms were developed at NIST and the Physikalisch-Technische Bundesanstalt (PTB) of Germany. The unique feature of this algorithm is the ability to estimate the uncertainty of its own results due to random errors. The StatistiCAL Plus algorithm features a high degree of robustness, as it is able to find solutions even with poor initial estimates. The NIST Microwave Uncertainty Framework extends StatistiCAL Plus, adding data post-processing related to calculating and propagating uncertainties through different models. The framework includes post processors that allow the uncertainties in measured S-parameters to be propagated to transistor gain, power, material parameters and other derived measurements and metrics. Both software packages were developed for metrologists and microwave measurement experts with the intention of post-processing already measured data offline, i.e., without a link to the VNA, probe system and device characterization software. Their application in a typical industry or university measurement laboratory and the integration into a common automated measurement workflow requires enormous programming and extensive experience in microwave metrology.
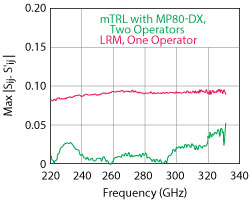
Figure 5 Repeatability of a lumped LRM calibration vs. operator error for the multiple TRL calibrations performed on the TS150-THZ with the MP80-DX option.
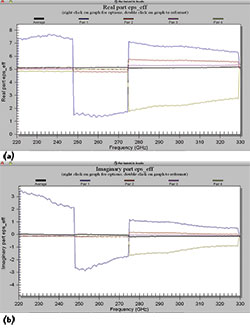
Figure 6 Real (a) and imaginary (b) parts of the effective dielectric constant εeff calculated and displayed by StatistiCAL Plus (debug case).
Now, NIST multiline TRL metrology-level VNA calibration from StatistiCAL Plus can be accessed through integration with MPI’s QAlibria® software. Both software packages work hand-in-hand in the system calibration and data analysis workflow (see Figure 4): QAlibria takes responsibility for interaction with the VNA, probe system and operator, while StatistiCAL Plus calculates calibration error terms and uncertainties, running in the background. With QAlibria’s multi-touch and multi-language graphical user interface, configuration mistakes are minimized, and accurate calibration results can be obtained, even by inexperienced users.
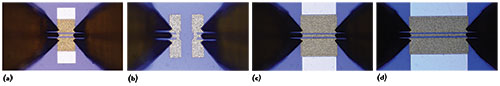
Figure 7 Coplanar standards from the CS15 calibration substrate and probes from GGB Industries, Inc.: thru (a), short (b), line 2 (c) and line 3 (d).
Calculating the multiline TRL error terms requires initial information about calibration standards, such as the type of the reflection standard (i.e., open, short or high reflection), physical length of the line standards and an initial estimate of the effective dielectric constant. The StatistiCAL algorithm requests the initial estimate for error terms as well as some specific settings for the NIST ODRPACK calculation engine. These definitions are automatically prepared by QAlibria and saved locally as the StatistiCAL Plus calibration menu file QAlibriaMenuNIST.scm in the local folder: \MPI\QAlibria\Data\StatistiCAL\. This folder also contains the raw data of the calibration standards measured by QAlibria (in the \_input\ directory) and the calibration results calculated by StatistiCAL, which are automatically saved as the solution vector Solution.txt in the \_output\ directory. Once the StatistiCAL Plus calculations are completed, QAlibria loads the solution vector and sends the error terms to the VNA. The system is fully calibrated without any interaction from the operator.
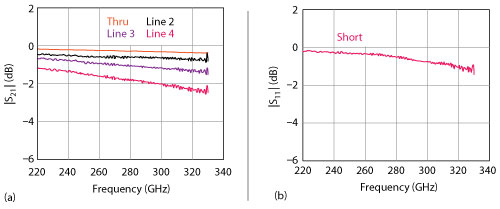
Figure 8 Corrected results of the CS15 CPW line (a) and short (b) standards.
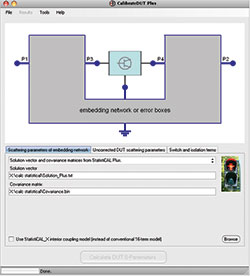
Figure 9 The CalibrateDUT Plus tool from the NIST Uncertainty Framework package.
REPEATABILITY AND REPRODUCIBILITY
The common features of MPI manual systems currently in the market include an air bearing stage, a highly repeatable platen lift with three discrete positions and the auto-contact feature. This latter feature is particularly important for improving contact repeatability and reproducibility of the DUT measured data, independent of the operator’s expertise. Figure 5 shows the experimental results for the calibration repeatability of the lumped line-reflect-match (LRM) and the multiline TRL methods with the CS15 commercial alumina calibration substrates and waveguide RF probes from GGB Industries, Inc. The LRM was executed twice sequentially and by the same experienced operator. The difference between these two calibrations was calculated using the calibration comparison method. Because the calibrations were performed sequentially, system drift was minimized, and the outcome of the calibration comparison method primarily presents the repeatability error of the LRM calibration. Next, four multiline TRL calibrations were performed, two by an experienced operator and two by an inexperienced operator. Each time, the digital micrometer was used to define the ∆l of each calibration line, per Table 1. The difference in the maximum repeatability error of the multiline TRL calibration performed by the two operators is significantly smaller than the single operator repeatability error of the LRM.
The multiline TRL enables accurate extraction of the propagation constant, γ, of the calibration lines and easy calculation of the effective dielectric constant, εeff. NIST StatistiCAL Plus can plot both the real and the imaginary parts of εeff for each line pair, together with the average values (see Figure 6). This is a handy feature for quick verification and debugging of calibration results. If required, the data can be exported as graphs or data files for further analysis. Another quick check of calibration success is to verify the corrected S-parameters of the line and reflection standards used for the calibration (see Figures 7and 8).
When detailed analysis of the DUT data, including calibration and measurement uncertainties, is required, the StatistiCAL Plus solution vector can be directly loaded into the Calibrate DUT Plus tool from the NIST Uncertainty Framework (see Figure 9). The DUT parameters can be calculated, including the standard uncertainties with 95 percent confidence intervals. The covariance matrix of the calibration uncertainties should also be exported from the StatistiCAL Plus menu (see Figure 10).
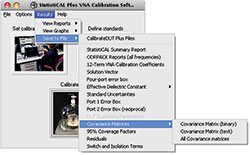
Figure 10 Exporting the calibration residual errors covariance matrix from StatistiCAL Plus.
Conclusion
To demonstrate the system’s capabilities, a four stage, 325 GHz MMIC low noise amplifier (LNA) developed by the Fraunhofer Institute for Applied Solid State Physics IAF was measured (see Figure 11). |S21| is shown with the ±95 percent confidence intervals.
The expansion to THz frequencies of wafer-level measurements demands new approaches for system integration, calibration, operation and data analysis. Wafer probe systems designed from the ground up can incorporate many innovative features to simplify system operation and re-configuration and provide the maximum measurement dynamic range and reproducibility. For the first time, it is possible to simplify the system calibration, device measurement and data analysis at the metrology level, by integrating the NIST StatistiCAL Plus and the NIST Uncertainty Framework software packages. Modular thermal and non-thermal chucks, advanced RF accessories (such as RF micro-positioners, RF cables, calibration substrates and RF probes), new calibration techniques and the integration of the VNA closer to the probe system yield a complete measurement solution that addresses the complexities and accuracy requirements of THz probing.
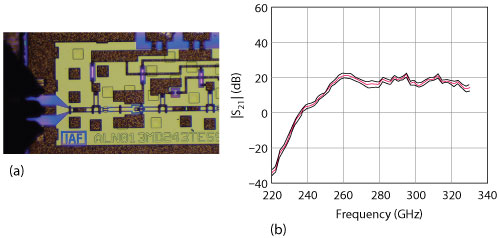
Figure 11 Fraunhofer Institute four stage, 325 GHz MMIC LNA (a) and measured S21 with the ±95% confidence intervals (b).