
The analytical and behavior models for direct conversion receiver IP2 nonlinear distortion characteristics have been derived. The impact of IP2 on system EVM, BER/PER performance was simulated. The trade-offs between IP2 distortion and other impairments, such as peak-to-average power ratio (PAPR), IP3, phase noise and I/Q mismatch, were investigated. The IP2 system specification related to other different impairments based on a direct conversion receiver architecture for an 802.11a system is given.
Direct conversion receivers are widely used due to their low cost, especially in wireless local area network (WLAN) systems defined by IEEE 802.11a/b/g. Nonlinear impairment of the input IP2 (IIP2) is particularly important for orthogonal frequency-division multiplexing (OFDM), multi-carrier direct conversion systems because of the large overlap signals between sub-carriers. The input second-order tones, caused either from the local oscillator frequency self-mixing or from external interference mixing products, represent one of the most common distortion effects on multi-carrier radio circuits and systems. The system susceptibility to interference in a direct conversion receiver, both from adjacent or alternative adjacent channel signals, can be severely degraded due to the poor second nonlinearity distortion. Therefore, it is necessary to have a full understanding of, and an accurate prediction for, the second-order nonlinear effects on the system performance, such as error vector magnitude (EVM), bit error rate (BER) and packet error rate (PER), so that system engineers as well as chip-level designers can optimize the receiver chain to meet system requirements.
Various techniques to analyze the second-order nonlinear distortion response have been described.1,2 Most of them only concentrate on the complicated formulas theoretically and are not related to the system performance directly. In this article, the analytical expressions on all second-order tone spectrum positions are derived. The level of the second-order tones generated from interference signals is predicted mathematically. A second-order behavior model was created with the Agilent Technologies Advanced System Design (ADS). The direct conversion receiver system performance, EVM, BER and PER based on an 802.11a OFDM signal multi-carrier system was set up and analyzed for the impairment of second-order effects. Finally, the system requirements for the input IP2 based on the simulation results are given by combining different impairments at the same time in a practical case.
The IEEE 802.11a specification defines the OFDM signal and its associated 52 sub-carriers, each spaced 312.5 kHz apart. If the direct conversion scheme is used in the receiver, the effect of the input IIP2 will become obvious, due to the inter-mixing products between each sub-carrier from adjacent as well as alternative adjacent channel signals. Half of these mixing products will fall within the signal band, which will degrade the receiver signal-to-noise ratio. The 802.11a documentation specifies that the alternative adjacent channel interference (AACI) be at a fixed power level of –47 dBm for all data rates. Compared to the –65 dBm sensitivity specification for a 54 Mbps data rate, AACI has the greatest impact on the IP2 effect due to the higher interference level specified. Therefore, the following analyses all assume that an AACI signal is present. To understand the mechanism of the degradation from these 52 carriers on the receiver performance in terms of input IP2, it is necessary to start with a simple two-tone, then with four-tone and up to 52 tones in the complicated scenario analysis.
 | |||
| Fig. 1 Second-order intermodulation products generated from two tones. | |||
Figure 1 shows a simple two-tone condition to generate different second-order intermodulation tones. If f1 and f2 are two interference signals from alternative adjacent channel interference that have the same power level, the relationships between the second-order products are
| f3 = f1–f2 | (1) | ||
| f4 = f1–f1 = f2–f2 | (2) | ||
| f5 = f2–f1 | (3) |
At the center frequency f4, the two generated IM2 products will be added to give the worst case among the other second-order tones. For the direct conversion receiver, only the f4 and f5 components are considered, which fall within the receiver band to degrade the receiver signal-to-noise ratio if the interference strength is comparable to the signal sensitivity level. The negative frequency f3 = f1 – f2 is ignored. Note that there are four other symmetric second-order tones located on the right side of the main input signals, which are not drawn here since these tones are located outside the band of interest for the direct conversion receiver.
 | |||
| Fig. 2 Second-order intermodulation products generated from four tones. | |||
To better understand the detailed relationships of second-order intermodulation tones between interferences, a four-tone case is generated, as shown in Figure 2. It shows that the inter-reaction products between different interferences become more severe if all of the interference signals are added.
The worst scenario is when all the N carriers generate the second-order intermodulation signals in the desired signal channel, as shown in Figure 3, where
Paac = total interference power
Paac-10log(N) = average alternate adjacent channel power of each carrier
Psen-10 log(N) = average sub-carrier power at sensitivity level
N = number of carriers in each channel
The spectrum position of the ith sub-carrier is given by
| M = 2(N+1–/i/) (4) | (4) |
I = index number of carriers (–N/2 M = number of occurrence of IM2 that falls at position of ith sub-carrier, the factor 2 is to account for both the higher side IM2 (f1+f2) and the lower side IM2 (f2–f1), assuming a symmetrical response
IM2 = second-order intermodulation generated by any two sub-carriers in a two-tone test
 | ||
| Fig. 3 Generation of the second-order intermodulation in the desired channel from cross-products of all sub-carriers in the alternative adjacent channel. | ||
The total second-order intermodulation power is given by
| Pim2 = IM2 + 10log(M) | (5) |
The model shows that the second-order intermodulation product is accumulated. If N = 52, Equation 5 demonstrates that the maximum IM2 magnitude could be 53 times higher than a simple two-tone scenario, which is equivalent to approximately 10log(53) = 17 dB, indicating that a more stringent IIP2 requirement, relative to a simple two-tone test, will be needed.
 | |||
| Fig. 4 Behavior model to simulate the IP2 effect. | |||
To apply the above concept of IIP2 to the direct conversion receiver, an IP2 behavior model, used in the ADS system simulation, was created by using a three-way splitter, one summer, one multiplier and two amplifier stages, as shown in Figure 4. This model implements a polynomial function having a second-order effect, which is given by
| Y = Ax + Bx2 | (6) |
where
A = voltage amplitude coefficients for the fundamental signals
B = voltage amplitude coefficients for the second-order signals
 | |||
| Fig. 5 Second-order baseband spectrum output from a two-tone input. | |||
To verify the correctness of this IP2 functional block, first a two-tone signal was applied to this model. The results are plotted in Figure 5. The two tones from m5 and m6 produce eight second-order tones located on both sides of the two main carriers. However, the tones plotted are only the seven positive tones, due to the receiver frequency starting from a positive frequency in a direct conversion receiver. The negative second-order tone is not considered here. In reality, only the three tones located on the left side of the main signals will degrade the signal-to-noise ratio of the receiver. For analysis, these seven second-order tones are plotted and given as
| f4 = f6–f5 | (7) | ||
| f7 = f5+f5 | (8) | ||
| f3 = f6–f6 | (9) | ||
| f8 = f6+f5 | (10) | ||
| f3 = f5–f5 | (11) | ||
| f9 = f6+f6 | (12) |
Comparing the second-order components with Equations 1 to 3, they are the same in terms of second-order tone components located at left side of the main signal.
 | |||
| Fig. 6 Second-order baseband spectrum from 52 carrier inputs. | |||
When the 52 carriers are applied at the same time, the spectrum due to the IP2 effect shows that a Gaussian distribution of second-order tones, located on both sides of main carriers, can be observed clearly, as shown in Figure 6. Compared to the analytical results given earlier, good agreement of second-order interference, based on multi-tones, can be obtained between analytical analysis and the behavior model.
Based on the above IP2 model generated from ADS, the EVM simulation block with added AACI function was created for OFDM with 54 Mbps 64QAM modulated signal in the system level, and is shown in Figure 7.
As indicated, the OFDM signal is 54 Mbps 64QAM in the main and interference paths. The main signal is synchronized between input and output for EVM purpose. The AACI signal is a conformant OFDM signal and unsynchronized with the main signal as specified in 802.11a. A desired signal strength of –62 dBm and an AACI level of –47 dBm are added to the receiver input. The IP2 model was inserted after the receiver mixer to simulate the effect of IP2 from previous stages.
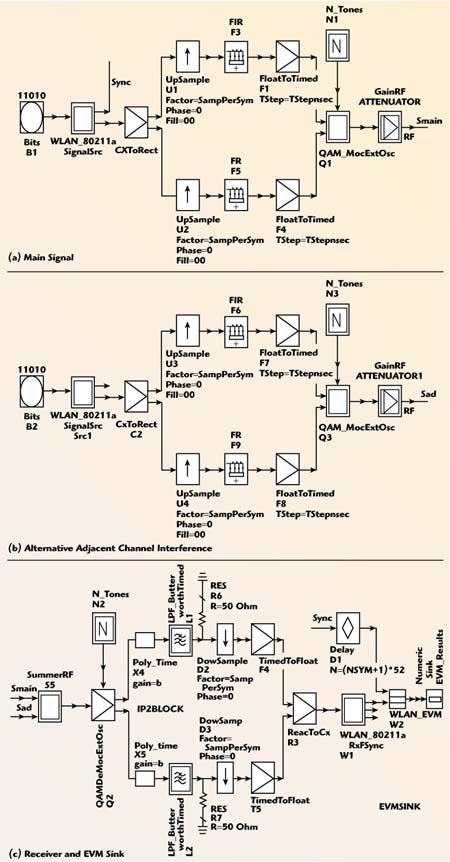 | ||
| Fig. 7 Block diagram for EVM simulation with AACI; (a) main signal path, (b) AACI signal path and (c) receiver and EVM sink. | ||
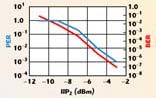
| Results Figure 8 shows the results of EVM versus IIP2 of the receiver without considering other impairments. If an EVM = –25 dB is assumed to be the specification for the receiver, the IIP2 needs to be –1 dBm. However, the EVM simulation at the receiver side cannot be the final result since there is no specification in 802.11a for an EVM requirement at the receiver. The simulated receiver EVM results can only provide a look for the first-order approximation on receiver performance. Normally, the receiver EVM can be used to judge the degree of impairments indirectly, due to its simple measurement procedures. To find the more practical specification for an IIP2 requirement based on the 802.11a system, the BER and PER should be used for the system receiver simulation. By modifying the EVM block to BER and PER function blocks in ADS, the BER and PER performance of the receiver can be obtained under a different IIP2 scenario. Figure 9 shows the BER and PER results versus IIP2. In this simulation, 54 Mbps with 64QAM OFDM modulated signals are used for both the main and AACI paths. As required in the 802.11a specification, the data length is taken as 1024 bytes. To get better PER and BER results, 200 frames are used. 802.11a specifies that PER should be less than 10 percent. Based on this specification, the IIP2 should be above –7 dBm to guarantee PER performance. Compared to the EVM simulation, there is approximately a 6 dB relaxation for PER simulation than for EVM simulation. This is mainly due to the fact that the equalization scheme used in PER/BER simulation improves the performance of the receiver, and is not applied during the EVM simulation. In order to get a realistic IIP2 specification for an 802.11a system, other impairments have to be considered at the same time. The main other impairments in the direct conversion receiver for an 802.11a system include peak-to-average power ratio (PAPR), IP3, I/Q mismatch and phase noise. The effects on the receiver performance, based on these impairments under certain IIP2 conditions, are investigated as follows. The PAPR related to the IIP2 impairment on the EVM effect was investigated since the level of the signal of the PAPR in the OFDM system will strongly affect the linearity of the system based on the analytical analysis. Figure 10 shows the EVM results when changing the peak-to-average ratio of AACI power. It clearly shows that the higher PAPR is, the worse EVM gets, as expected. To get –25 dB EVM, the interference peak value can be tolerated up to 12 dB when IIP2 is greater than –1 dBm. It indicates that the OFDM system will get better performance at a relative high PAPR value if the IIP2 performance is improved at the receiver. The relationship between PAPR and IIP2 for BER/PER performance is shown in Figure 11. The PER or BER performance will be degraded severely as PAPR increases when IIP2 is only –10 dBm. The result shows that PER or BER cannot meet specifications if PAPR is greater than 3 dB. Therefore, the IIP2 performance has a very important role in affecting system performance if IIP2 is not high enough. In any radio system, the other most important nonlinear distortion is IIP3. To understand the trade-off between IIP2 and IIP3 on system performance, the PER characteristics of the receiver were investigated by combining the effects of IIP3 and the IIP2 distortions. As shown in Figure 12, the IIP2 has to be greater than –5 dBm and the IIP3 has to be greater than –32 dBm in order to meet the system PER 10 percent specification for an OFDM 54 Mbps signal. The effect of IIP2 was also investigated with I/Q mismatch changes. In the simulation, assuming no phase error, only the gain error is presented. The PER performance vs. gain errors at different IIP2 is shown in Figure 13. To meet a PER 10 percent specification, the gain error has to be less than 0.5 dB with IIP2 greater than –6 dBm. Note that in the simulation, the IIP3 and noise figure of the receiver has to be taken into account realistically. Finally, the IIP2 effect on the receiver PER performance was investigated under all normal impairment conditions so that the true IIP2 specification, based on the practical situation, can be revealed. In this investigation, the channel IIP3, noise figure, gain and phase errors, and phase noise profile, are included. Figure 14 shows the typical phase noise performance in the 5 GHz band, which is used in the simulation. IIP3 is –25 dBm and the receiver noise figure is 8 dB. The gain error can be assumed at 0.1 dB and the phase error could be up to 1°. PAPR is assumed to be 8 dB. Under these conditions, the PER versus IIP2 simulation was performed, as shown in Figure 15. It shows that an 802.11a system will need a –3 dBm IIP2 in order to meet the PER specification. Compared to an IIP2 of –7 dBm result, when no impairments are considered, an additional 4 dB is required to meet the PER requirement. If one is considering some margin over voltage, process and temperature changes of the system, it is safe to estimate that another 3 dB margin should be added to compensate for these changes. Conclusion Based on an ADS simulation, the IIP2 requirement for a direct conversion receiver is approximately –5 dBm to meet a 10 percent PER 802.11a standard requirement if the alternative adjacent channel has –47 dBm interference for a 54 Mpbs 64QAM OFDM signal. However, if other impairments are included, such as IIP3, I/Q mismatch, PAPR and phase noise, according to the modeling performed in this article, it is expected that a 0 dBm IIP2 will be needed to meet the 802.11a system requirements. References
|
| ||||||||||||||||||||||||||||||||||||||||||||||||||||||||||||||||||||||||||||||||||||||||||||||||||||||||||||||||||||||||


| Results Figure 8 shows the results of EVM versus IIP |